.png)
Abu Dhabi faces a strategic choice in scaling up solar energy: centralised mega-projects or decentralsed rooftop systems. This paper by our Director PJ McCloskey and analyst Rodrigo Remor analyses why distributed solar uptake remains low in Abu Dhabi and evaluates its economic viability under current conditions. Abu Dhabi has so far favored large solar parks (e.g. the 1.17 GW Noor Abu Dhabi plant) while rooftop solar adoption is minimal (~2.94 MW on government buildings by 2020, <1% of Noor’s capacity). Given the UAE’s net-zero commitment and Energy Strategy 2050 targets (44% renewable electricity by 2050), the study explores whether decentralised solar could play a larger role and what policy shifts might be required.
This paper evaluates the economic viability of decentralised solar systems in Abu Dhabi. By analysing levelised cost of electricity (LCOE), net present value (NPV), and internal rate of return (IRR) across customer groups, it finds that while rooftop solar generation is not yet cost-effective for heavily subsidised sectors, it remains viable for industrial and commercial users. The study suggests that subsidy reform could significantly improve the financial appeal of decentralised systems, aligning with Abu Dhabi’s decarbonisation targets under the UAE Energy Strategy 2050.
Explore our latest paper which examines Abu Dhabi’s solar approach - centralised utility-scale vs. distributed rooftop generation. Finds rooftop PV still uneconomical for heavily subsidised user groups but cost-effective for industry and commerce, suggesting subsidy reforms to unlock distributed solar for 2050 climate goals.
PJ McCloskey
Economic consulting
MCC Economics & Finance
Abu Dhabi, UAE
Rodrigo Malheiros Remor
Economic consulting
MCC Economics & Finance
Abu Dhabi, UAE
Abstract – This paper evaluates the economic viability of decentralised solar systems in Abu Dhabi. By analysing levelised cost of electricity (LCOE), net present value (NPV), and internal rate of return (IRR) across customer groups, it finds that while rooftop solar generation is not yet cost-effective for heavily subsidised sectors, it remains viable for industrial and commercial users. The study suggests that subsidy reform could significantly improve the financial appeal of decentralised systems, aligning with Abu Dhabi’s decarbonisation targets under the UAE Energy Strategy 2050. Keywords—renewable energy, solar energy, decentralised solar, centralised solar, LCOE, Abu Dhabi
Solar energy refers to the heat and electricity produced by harnessing sunlight through specific technologies. It is generated by capturing and converting solar radiation into usable power. The electricity-producing solar systems, which this paper focuses on, primarily use two methods: Photovoltaics (PV) and Concentrated Solar Power (CSP) [1].
The global installed generation capacity of solar energy is divided between centralised (also called “utility scale”) and decentralised systems (also called “distributed generation”).
Centralised solar plants generally refer to large-scale installations for sunlight-based electricity generation. These systems tend to generate massive amounts of electricity, potentially displacing the use of carbon intensive fossil fuel- powered plants. Centralised solar plants often benefit from economies of scale as well, which lower costs and make solar energy more competitive against traditional power sources.
Decentralised solar systems offer a more localised approach, as they involve setting up PV panels at distributed locations, usually closer to the final consumers. By generating electricity on-site, these systems reduce the need for power from the grid, which may have been generated using fossil fuels or other forms of low carbon energy (such as nuclear), and usually suffer from transmission losses.
Globally, solar PV is equally popular in both centralised and decentralised formats. Figure 1 shows that the split between decentralised and centralised solar PV is about 50:50. In Abu Dhabi, however, decentralised solar PV is much less popular than centralised solar. In 2020, decentralised (Rooftop) PV on government buildings reached 2.94 MW by 2020 which is less than 1% of the Noor solar farm capacity of 1,177 MW alone [2] [14].
Accordingly, this paper asksthe following questions. Why is there “a preference for large-scale projects” [3] (centralised solar, utility scale) over decentralised solar (distributed generation) [3]? Why is Dubai’s decentralised (rooftop PV)
scheme apparently more successful than Abu Dhabi’s [2]? Is decentralised solar still not economically viable given the low electricity tariffs [6]? Is centralised solar so cheap that decentralised solar is not worthwhile [10]? Is the net metering policy unattractive or useless [14]? Are there technical, behavioural, and/or societal issues that negatively impact the deployment of distributed solar PV [4]?
Figure 1: Historical uptake of global solar energy capacity (GW) by type of generation system and 2030 target for net zero [5]
The International Energy Agency (IEA) forecasts solarenergy capacity additions to increase three-fold by 2028compared to the 2022 levels, as indicated in
Figure 2.Figure 2: Forecast for global solar energy installed capacity additions (GW)
The potential of solar radiation in United Arab Emirates(UAE) is significant, with the global horizontal irradiance (GHI), a standard measure of solar radiation, of approximately 6.045 kWh/m2 per day [17]. UAE has set the target to achieve net zero for energy and water sectors by 2050. This commitment is included within the UAE Energy Strategy 2050 [8].
The net zero commitment forms the basis for the measures that UAE government is taking to drive penetration of decentralised renewable energy generators (e.g. rooftop solar panels and solar water heating). Solar energy has also been identified as a priority area by Ministry of Climate Change and Environment (MOCCAE) in their National Climate Change Plan of the United Arab Emirates and has been included as one of its key Long-term actions (2030-2050) [9].
In the Electricity 2024 report, IEA forecasted that the CO2 intensity from electricity in UAE is expected to fall below 400g CO2/kWh by 2026 [11]. The UAE Government has further set the target to reduce the CO2 emissions to 270g CO2/kWh by 2030 [8]. In 2023, the UAE updated its National Energy Strategy to include an interim goal of raising the contribution of renewable energy in the total energy mix to 30% by 2031 [21], to augment the initial aim of achieving44% share of renewable energy by 2050, as in Figure 3.
Figure 3: UAE share of renewable energy (%) in total electricity production [20] and UAE Energy Strategy goals
The Emirates Water and Electricity Company (EWEC) has also set the target to increase Abu Dhabi's total solar power capacity to 7 GW by 2030 [12].The Noor Abu Dhabi power plant, located at Sweihan, began commercial operations in April 2019. It covers an area of 8 square kilometres and uses 3.2 million solar panels to produce approximately 1 gigawatt (AC) of power [18]. The Mohammed bin Rashid Al Maktoum Solar Park is the largest single-site solar park in the world, based on the Independent Power Producer (IPP) model, and has a planned production capacity of 5,000 MW by 2030 [13].
Researchers and industry professionals use levelised cost of energy (LCOE), a standard metric to measure the average net present cost of electricity generation for the generation system over its lifetime [14][13]. In Figure 4, we showcase the LCOE (US cents/ kWh) for some of the key centralised solar energy generation projects in the Gulf Cooperation Council (GCC) region.
Figure 4: LCOE (US cents/ kWh) for centralised solar energy projects inthe GCC region [19]
Studies on UAE’s current policy frame ork regarding theadoption of renewable energy, specifically decentralised solar,indicate that implementing a unified renewable energy policyincluding a feed-in tariff (FiT) mechanism and net meteringcould significantly enhance the adoption of decentralised solarenergy generation across all of the UAE’s electricityauthorities [23]. As a potential policy adjustment,incentivizing rooftop solar installations on residential andcommercial buildings could contribute to the energy mixwhile empowering communities and individuals to participatein the renewable energy transition [26].
On an LCOE basis, decentralised solar energy could be 4 times higher than its centralised counterpart. However, the LCOE is misleading because it measures the cost ‘at production’ rather than the ‘landed’ (delivered) cost, which is more important for customers and policy makers [24]. For example, LCOEs for centralised solar generally exclude grid-related transportation, balancing, intermittency, losses, and peak power costs [25]. Another cost metric, LFSCOE (Levelised Full System Cost of Electricity “ ystem LCOE”) has been proposed to improve comparability [26]. In Germany, the LFSCOE for centralised solar is 43 times greater ($/MWh, 1548 / 36) than its LCOE [27]. Accordingly, the actual “landed cost” of solar may, in fact, be higher for centralised systems than decentralised systems [10].
By generating electricity on-site, decentralised systemscan reduce the need for power from the grid, which may havebeen generated using fossil fuels or other forms of low carbonenergy (such as nuclear).
Decentralised solar systems such as residential rooftop solar plants face inherent limitations due to factors such as rooftop size and shading, which tend to impact the total energy output. Centralised solar plants, on the other hand, require significant land area and face challenges related to comparatively longer construction timelines and grid integration issues.
The challenges posed by these intermittent renewable energy systems need to be addressed individually, as both options pose an attractive proposition in contributing to decarbonisation efforts. To compare both systems, our analysis for both centralised and decentralised solar generation plants is based on a widely accepted methodology for calculating the LCOE [14] and is defined below (1):
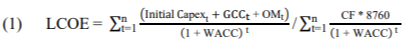
Where t indicates the year of the asset’s operation, ranging between 1 and n, where n represents the asset’s operating life in years. The initial CAPEX indicates the total upfront cost of setting up the power generation plant, including construction and assembly costs. The grid connection costs (GCC) refer to the distance-based costs of spur lines over land and construction-period transit costs. Operation and maintenance expenses (OM) cover the annual expenditures required to operate and maintain the solar energy generation equipment. WACC represents the weighted average cost of capital used for financing the project assets during the asset’s operating life [15]. The Capacity Factor (CF) is the ratio of actual annual output to the output at rated capacity for an entire year and has been considered as 32% in TAQA’s base case estimations. Following TAQA’s lead, this value is adopted in our calculations. The numerical value 8760 represents the conversion factor for the total available hours in a year, calculated as 24 × 365.
The National Renewable Energy Laboratory (NREL) intheir “ Electricity Annual Technology Baseline”calculates the LCOE (USD/kWh) using equation (2), wherethey consider the cost of energy for each year separately,through the project life of the energy producing asset [16].
(2) 𝐿𝐶𝑂𝐸 = ((𝐶𝑅𝐹 ∗ 𝑃𝐹𝐹 ∗ 𝐶𝐹𝐹 ∗ (𝑂𝐶𝐶 ∗ 𝐶𝑅𝑀 +𝐺𝐶𝐶)+𝐹𝑂𝑀) ∗ 1000/(𝐶𝐹 ∗ 8760))+ 𝑉𝑂𝑀 +𝐹𝑢𝑒�
• CRF = Capital recovery factor – the ratio of a constant annuity to the present value of receiving that annuity for a given length of time;
• PFF = Project finance factor – a technology-specific financial multiplier that adjusts for depreciation schedules and tax policy variations;
• CFF = Construction finance factor – the construction period financing share of total capital cost;
• OCC = Overnight capital costs – the calculated Capex if the plant was constructed overnight;
• CRM = Capital regional multiplier – a multiplier for regional capital cost variation;
• FOM = Fixed OM;
• VOM = Variable OM; and
• Fuel = calculated fuel cost in $/MWh.
We refer to the methodology used by NREL and consider a modified approach of calculating LCOE, using a simplified equation (3), which allows us to compare the decentralised and centralised solar systems on an annual basis during the forecast period.
(3) 𝐿𝐶𝑂𝐸 = (𝐶𝑅𝐹 ∗ (𝐼𝑛𝑖𝑡𝑖𝑎𝑙 𝑐𝑎𝑝𝑒𝑥 + 𝐺𝐶𝐶)+𝑂𝑀) ∗1000/(𝐶𝐹 ∗ 8760)
We calculate CRF using equation (4).
(4) 𝐶𝑅𝐹 = 𝑊𝐴𝐶𝐶 ∗ (1 / (1 – (1 / (1 + 𝑊𝐴𝐶𝐶))))
In addition to the LCOE, we calculate the net present value(NPV) of the total cashflows for each of the plants usingequation (5), to ascer
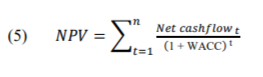
where net cashflow for period t is calculated as in equation (6):
(6) 𝑛𝑒𝑡 𝑐𝑎𝑠ℎ𝑓𝑙𝑜𝑤 = CF ∗ 8760 ∗ tariff − capex − OM
In Abu Dhabi, the government currently subsidises the use of electricity indirectly. It provides a subsidy to the energy companies, which allows them to keep the customer tariff well below the economic cost, i.e. the total cost of generating, transmitting, and distributing each unit of electricity.
We use Abu Dhabi Department of Energy’s (DoE) pricecontrol (RC-2) final determinations [37] and TAQA’s 2023 financial statements [38] to estimate the impact of these subsidies on the energy sector costs and its customer groups.
In the context of these subsidies, we further evaluate the feasibility of setting up decentralised solar plants by different customer groups, assuming that the set-up cost is borne by the consumer. This feasibility is calculated using the standard financial metrics of internal rate of return (IRR) and payback period on initial investment, while considering the OM expenses and the cost of electricity that is avoided by system’s local generation. The costs incurred, namely the initial investment and OM expenses, are considered outflows and we refer to them as outgo, while the costs avoided are considered income in our calculation.
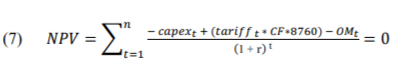
The IRR (r) is defined as the rate of discount that makes NPV = 0[39] and is calculated through equation (7):
The payback period (y) is defined as the time in years,between initial outlay of capital to install a solar generationplant and the return on this initial investment [40], consideringthat income equals the cost of electricity that is avoided bylocal generation. We calculate the payback period using amodified equation for a simple payback period, to determiney in (8), when total outgo is expected to equal the total income:
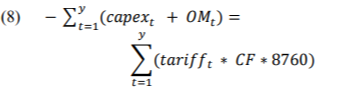
Table 1: THE SPECIFICATIONS FOR SYSTEMS CONSIDERED IN CENTRALISED AND DECENTRALISED ENERGY PLANTS
This section discusses the input datasets used in our analysis such as details for the system specifications, cost categories and inputs, and other assumptions.
The solar cells are largely available in three categories: mono crystalline, multi crystalline and thin film PV cells, in decreasing order of efficiency and cost [30].
The specifications for solar systems [31] included in Table 1 have been considered for the calculations presented in this paper.
The Abu Dhabi Distribution Company (ADDC), an electricity distribution company in the UAE, charges separate base tariffs to different customer groups, as in Table 6.
We refer to the tariffs presented in Table 2 for our analysis, to estimate the customer level savings, payback period and IRR from installation of a decentralised solar generation system.
Table 2: ADDC 2024 CUSTOMER TARIFFS (AED/ kWh) [34]
TAQA, in their annual accounts for 2023, present the consolidated financial statements for their subsidiary companies, including ADDC, Al Ain Distribution Company (AADC) and Abu Dhabi Transmission and Despatch Company (Transco) [38]. We refer to the notes to accounts for the financial data to estimate the total generation, transmission and distribution (T&D) revenue. Subsequently, we estimate that the power revenue (generation, T&D) is 65% of the total revenue from power and water, while the remaining 35% revenue is from water and allied services.
TAQA also separately indicate ‘Other operating revenue’, which they calculate as the difference between ‘Maximum allowed revenue’, as defined in the RC-2 final determinations and the revenue collected from the customers. We refer to this amount as the total ‘subsidy’ borne by the Abu Dhabi Government. We further assume that 65% of this total subsidy amount is split in the ratio of 0.75:0.25 between power generation and power T&D, to estimate the total power generation revenue and power T&D revenue.
TAQA annual report states UAE generation of 58,731 GWh (58.7 TWh) is 71% of Abu Dhabi’s electricity requirement. Thus, we infer Abu Dhabi’s electricity requirement is 82.7 TWh (58.7/ 71%). This also aligns with the Department of Energy price control assumptions for Transco (82,628 GWh for 2023) [37].
We calculate the implied economic cost of electricity to the Government, by separately calculating and adding the power generation tariff and power T&D tariff, using the revenue and electricity volume data.
The analysis refers to capital expenditure and operating expenditure data for setting up and maintaining centralised and decentralised solar plants, as highlighted in Table 3. We rely on inputs from Falcon Energy, an installer in the UAE, for capex inputs for rooftop and ground-mounted solar plants. Further, we use the published LCOE (US$1.6215 cents/ kWh) for the sixth phase of Mohammed bin Rashid Al Maktoum Solar Park, UAE [33] and derive the indicative capex (AED 1,221/kW) for a centralised solar plant, shown in Table 3. The bifurcation of capex and opex into the sub-costs is referenced from NREL’s cost-breakdown for utility-scale solar [29].
We consider the different size and installation options for decentralised solar set-ups for residential and commercial and industrial customers as presented in TAQA’s financial statements. They are shown in Table 4.
Table 4: Decentralised solar generation system - size and capex
In 2024, Abu Dhabi is estimated to have over 3.1 GW of rooftop solar potential with over 17.8 thousand rooftops in the commercial and industrial sectors [41].
The construction period is assumed to be 3 months for residential, 6 months for non-residential customers and 1 year for setting up the decentralised solar generation of 292 MW, in Abu Dhabi in our base adoption scenario.
UAE CPI of 2% is assumed for cashflows starting 2025 for forecasting tariff and costs. We rely on International Renewable Energy Agency’s (IRENA) estimate of 464 tonnes of CO2 emissions in UAE per GWh of electricity generation [36].
The capex assumptions for a centralised solar plant excludes grid connection costs, transmission and distribution costs, and financing costs.
In Abu Dhabi, the Small-scale Solar PV Energy Netting Regulation was issued in 2017 [35]. Our analysis assumes that the benefit to the customer for each unit of electricity generated from decentralised solar equals the retail value (i.e. “Net metering” – the owners are paid the same price for electricity they sell to the grid as electricity they buy from the grid).
We use IEA estimates for the UAE, to bifurcate the electricity consumption in Abu Dhabi by different customer groups, as shown in Table 5 below.
Table 5: UAE electricity consumption by customer group-2022 [42]
The specific impact of decentralised and centralised solar systems, especially on grid-stability, can vary depending on factors such as grid size, solar penetration levels, and the presence of other renewable energy sources such as wind, hydro. It is important to consider these factors when evaluating the potential benefits and challenges of different solar energy deployment strategies.
According to our analysis of Abu Dhabi Department of Energy’s price control (RC-2) final determinations and TAQA’s 2023 financial statements, the average economic cost for electricity lies in the range of 36-41 fils/ kWh (0.36-0.41 AED/kWh).
Until recently, rooftop solar was not viable in Abu Dhabi [6], as the costs were too high. However, that is not the case anymore. Since 2016, the costs have materially reduced and fallen below both the economic cost and the tariff charge levels.
Figure 5: MCC analysis of LCOE for solar energy projects and comparison with Economic cost of electricity and tariffs (AED/kWh)
We estimate that rooftop solar is very cheap, at 12 fils/kWh, compared to the economic cost of electricity of 39 fils/kWh and to the expats tariff of 27 fils/kWh. However, it is not cheap enough for UAE nationals on the heavily subsidised retail tariff (7 fils/kwh) or for agricultural customers (5 fils/kwh) as shown in Figure 5.
Ground-mounted solar, at 22 fils/kwh, is not as attractive to customers on the expat tariff of 27 fils/kWh or commercial tariff of 30 fils/kwh, but it is still worthwhile for the Government, because its significantly cheaper than the economic cost of 39 fils/kwh.
For each customer group in Abu Dhabi, we estimate costs and savings for both rooftop and ground-mounted solar systems. We modelled these and estimated the returns on investment (IRR) and payback periods. The results from our analysis are shown in Table 6.
Our analysis of distributed solar generation projects based on current cost data indicates that rooftop and ground-mounted solar systems can deliver electricity with LCOEs in the range of 11 fils/kWh (rooftop, residential) to 22 fils/kWh (ground-mounted, industry). Notably, the difference in returns and payback analysis is largely due to the subsidy effect, as our analysis indicates that the payback period and IRR from the customers’ perspective have little correlation to LCOE, especially in the UAE national’s case.
If there was no subsidy from the UAE government, the overall benefits would be larger. Since the IRR for UAE nationals is low (0.2% – 1.4%), there is a large benefit to the UAE government from the adoption of decentralised solar energy, as the subsidy would be reduced by the largest amount, 0.32 AED/kwh, to the UAE nationals, as shown in Figure 5. This large decrease would also occur for customers in the agriculture sector.
We consider three adoption scenarios, for decentralised solar starting 2025 in Abu Dhabi – 0.5%, 1.0% and 1.5%, of total electricity required.
In the base case, we estimate that the total set-up cost to generate 1% of Abu Dhabi’s electricity requirement is AED 1,342 million, with an estimated annual electricity generation of 826 GWh. We further estimate an annual reduction in subsidy borne by the Government will be AED 112.1 million, in a situation that is simultaneously beneficial for the government, customers and the environment.
TABLE 6: MCC ANALYSIS OF DISTRIBUTED SOLAR GENERATION - CUSTOMER GROUPS, RESPECTIVE TARIFF, SIZE, COSTS, PAYBACK PERIOD AND IRR
For each adoption scenario, we calculate the total set-upcost, total electricity generated, and carbon emissions avoided.The outputs are summarised in Figure 6.
Figure 6: MCC analysis for three adoption scenarios, distributed solar size,set-up cost and CO2 emissions avoided
To decarbonise and achieve net zero, one of the key stepshighlighted in the National Climate Change Plan includes asubsidy reform [9]. As part of this, revision in tariff structuresshall be undertaken by the water and electricity authoritiesthroughout the country, with an aim to cut subsidies tocustomers and increase prices gradually.
The current electricity tariffs, especially for the localcitizens of UAE, discourage the deployment of distributedsolar technology. [22] However our analysis shows that theeconomics are attractive for all electricity customers, exceptthose on the “local citizen tariff”
We show the breakdown of the implied annual reductionin subsidy for the base case, by customer group in Figure 7.
Figure 7: Abu Dhabi tariff vs implied subsidy reduction in Base case fordistributed solar (by customer group)
Taking Abu Dhabi as an example, we have shown, in thispaper, how subsidies may impede net zero targets. By payingfor everyone’s electricity costs the government displays itsgenerosity, but under certain circumstances subsidies can beself-defeating and bad for climate change. Clean-energyinvestments likely are a better use of subsidy monies –potentially simultaneously benefiting the government,customers and the environment.
In the base case scenario for setting up distributed solarenergy generation in Abu Dhabi, we estimate that 292 MW ofgeneration capacity would be set up during 2025, to supply1% of total electricity requirement. Subsequently, we modelthree different scenarios – A, B and C, for different growthrates in incremental annual capacity, i.e. 10%, 21% and 30%.As per scenario C, we expect the total annual generation fromdistributed solar to be 10.8 TWh, which would supplyapproximately 10% of the estimated electricity demand, so it
TABLE 7: MCC ANALYSIS OF DISTRIBUTED SOLAR ADOPTION SCENARIOS AND COMPARISON WITH CENTRALISED SOLAR APPROACH
seems fairly reasonable. The results from our analysis arepresented in TABLE 7.
We further model the capacity increase in centralised solargeneration in Abu Dhabi, with an estimated capacity of 10.3GW by 2030. Based on the data available, planned projects byTAQA and our forecast assumptions, we display the historicaland forecasted solar generation capacity between 2018 to2030, in Figure 8.
Figure 8: Historical and forecasted capacity - Centralised vs distributedsolar (GW
In scenario C, the investment in distributed solar would translate into a reduction of annual subsidy by AED 1.47 billion (real, 2024 prices) and an annual reduction of 5 million tonnes of carbon emissions in 2030.
The potential for distributed solar generation offers apromising avenue for local private sector engagement in AbuDhabi's expanding clean energy landscape. Abu Dhabi canenhance its strategic energy options, boost the local economy and clearly demonstrate its commitment to sustainability.
The net metering scheme in Abu Dhabi was not found to be an economic or technical barrier [35] to this implementation. Distributed solar generation is cheap enough to benefit the UAE government (and the economy) in all our scenarios/customer groups. However, distributed solar is not cheap enough to be attractive to customers who receive the largest government subsidies, namely UAE nationals and agricultural customers. Our analysis also shows that the economics of distributed solar are very attractive, given the average payback period of only 5 years as show in Table 6 above.
Future research should be directed at the potential reasons
for the slow update of decentralised solar generation in Abu Dhabi, such as:
1. costs for setting up distributed solar generation not being economically viable until quite recently, for most consumers;
2. lack of space for a large enough rooftop system to meet the daily energy requirements;
3. skepticism regarding the success of distributed generation over a long term use
4. the short-term nature of residence for expats and nearterm planning of businesses;
5. legal barriers to implementation (e.g. DoE determination [43]);
6. subsidised tariffs;
7. asset stranding;
8. displacement effects; and
9. issues with grid management and tariff pricing (e.g. negative prices, access charges).
Further research is also needed to explore several critical dimensions of decentralised solar generation in Abu Dhabi. First, the optimal level of distributed generation for Abu Dhabi, considering factors such as grid stability, energy demand, and cost efficiency, remains an open question. Policymakers, particularly within the Department of Energy
Abu Dhabi, should examine tailored policy options to incentivize solar adoption in buildings while ensuring grid reliability and long-term sustainability.
Additionally, the impact of battery storage systems on the efficiency and reliability of distributed solar needs further investigation [28], particularly in relation to technological advancements and their indirect costs.
Furthermore, the sale of carbon credits from decentralised solar projects and the integration of demand response planning, net metering policies, and electric vehicles (EV) storage present other opportunities for deeper research.
[1] Office of Energy Efficiency and Renewable Energy, “How does solar work?”. (Accessed 26 September 2024)
[2] Ramachandran, T.; Mourad, A.-H.I.; Hamed, F. A Review on Solar Energy Utilization and Projects: Development in and around the UAE. Energies 2022, 15, 3754. https://doi.org/10.3390/en15103754
[3] Hamdi, Mourad. (2024). The Effectiveness of Solar Photovoltaic Energy Policies in Dubai and Abu Dhabi. IEEE Access. 1. 1. 10.17605/OSF.IO/64QGY.
[4] Seetharaman, Krishna Moorthy, Nitin Patwa, Saravanan, Yash Gupta, Breaking barriers in deployment of renewable energy, Heliyon, Volume 5, Issue 1, 2019, e01166, ISSN 2405-8440, https://doi.org/10.1016/j.heliyon.2019.e01166
[5] IEA, “Solar PV tracking”. (Accessed 26 September 2024)
[6] S. Griffiths, R. Mills, Potential of rooftop solar photovoltaics in the energy system evolution of the United Arab Emirates, Energy Strategy Rev. 9 (2016) 1e7, https://doi.org/10.1016/j.esr.2015.11.001.
[7] IEA, “Electricity”, Renewables 2023. (Accessed 26 September 2024)
[8] Ministry of Energy & Infrastructure, “UAE Energy Strategy 2050”, July 2023.
[9] Ministry of Climate Change and Environment, “National Climate Change Plan of the United Arab Emirates”, pp. 45, 52.
[10] Sapan Thapar, Centralized vs decentralized solar: A comparison study (India), Renewable Energy, Volume 194, 2022, Pages 687-704, ISSN 0960-1481, https://doi.org/10.1016/j.renene.2022.05.117
[11] International Energy Agency, “Electricity 2024”, pp. 64.
[12] Emirates Water and Electricity Company (EWEC), “EWEC Meets Over 80 Per Cent of Total Power Demand Using Renewable and Clean Energy Sources”, March 2023.
[13] Government of Dubai, “Mohammed bin Rashid Al Maktoum Solar Park”. (Accessed 25 September 2024) last accessed on.
[14] Hasan Alhammami, Heungjo An, “Techno-economic analysis and policy implications for promoting residential rooftop solar photovoltaics in Abu Dhabi”, UAE, Renewable Energy, Volume 167, 2021, Pages 359–368.
[15] Short, W., Packey, D. J., & Holt, T., “A manual for the economic evaluation of energy efficiency and renewable energy technologies”, United States.
[16] NREL, “Equations and Variables in the ATB”. Accessed 25 September 2024.
[17] Global Solar Atlas, “Global Photovoltaic Power Potential by Country”. Accessed 26 September 2024.
[18] EWEC, “Noor Abu Dhabi”. Accessed 26 September 2024.
[19] Alashqar, Mohamed & Xue, Ying & Yang, Conghuan & Zhang, X.-P., “Comprehensive economic analysis of PV farm - A case study of Alkarsaah PV farm in Qatar”, Frontiers in Energy Research, 2022.
[20] Enerdata, “United Arab Emirates Energy Information”. Accessed 26 September 2024.
[21] Embassy of the United Arab Emirates Washington DC, “UAE Energy Diversification”. Accessed 26 September 2024.
[22] Griffiths, S., “Strategic considerations for deployment of solar photovoltaics in the Middle East and North Africa”, Energy Strategy Reviews, 2(1), 125–131, 2013.
[23] Alsalman M., Ahmed V., Bahroun Z., Saboor S., “An Economic Analysis of Solar Energy Generation Policies in the UAE”, Energies, 2023, 16(7):3165.
[24] You, D. K., & Hargreaves, S. (2024, April). “Issues with levelised cost of electricity: Why a simple metric cannot determine our energy future”, Institute of Public Affairs Working Paper Series.
[25] Moses Jeremiah Barasa Kabeyi, Oludolapo Akanni Olanrewaju, “The levelized cost of energy and modifications for use in electricity generation planning,” Energy Reports, Volume 9, Supplement 9, 2023, Pages 495–534. DOI
[26] Falko Ueckerdt, Lion Hirth, Gunnar Luderer, Ottmar Edenhofer, “System LCOE: What are the costs of variable renewables?”, Energy, Volume 63, 2013, Pages 61–75. DOI
[27] Robert Idel, “Levelized Full System Costs of Electricity,” Energy, Volume 259, 2022, 124905. DOI
[28] Mas’ud, A., Wirba, A., Alshammari, S., Muhammad-Sukki, F., Abdullahi, M., Albarracin, R., & Hoq, M., “Solar energy potentials and benefits in the Gulf Cooperation Council countries: A review of substantial issues”, Energies, 11(2), Article 372, 2018.
[29] Ramasamy, Vignesh, Jarett Zuboy, David Feldman, Robert Margolis, Jal Desai, Andy Walker, Michael Woodhouse, Eric O’Shaughnessy, and Paul Basore, “Q1 2023 U.S. Solar Photovoltaic System and Energy Storage Cost Benchmarks With Minimum Sustainable Price Analysis Data File”, NREL Data Catalog, Golden, CO: National Renewable Energy Laboratory, 2023.
[30] P. Raman, J. Murali, D. Sakthivadivel, V. S. Vigneswaran, “Opportunities and challenges in setting up solar photovoltaic based micro grids for electrification in rural areas of India”, Renewable and Sustainable Energy Reviews, Volume 16, Issue 5, 2012, Pages 3320–3325.
[31] Ramasamy, Vignesh, Jarett Zuboy, Michael Woodhouse, Eric O’Shaughnessy, David Feldman, Jal Desai, Andy Walker, Robert Margolis, and Paul Basore, “U.S. Solar Photovoltaic System and Energy Storage Cost Benchmarks, With Minimum Sustainable Price Analysis: Q1 2023”, Golden, CO: National Renewable Energy Laboratory, NREL/TP-7A40-87303, 2023.
[32] I. M. Alhamad, “A feasibility study of roof-mounted grid-connected PV solar system under Abu Dhabi net metering scheme using HOMER,” Adv. Sci. Eng. Technol. Int. Conf. ASET, 2018. DOI
[33] Masdar, “DEWA and Masdar reach financial closing on 1800MW 6th phase of Mohammed bin Rashid Al Maktoum Solar Park”.
[34] “Utility Tariff 2024”.
[35] “Small-Scale Solar Photovoltaic Energy Netting Regulations First Edition”, 2017. Accessed Nov. 01, 2024.
[36] “Energy Profile”, 2015.
[37] “Consultation General Review of Regulatory Controls of AADC, ADDC, ADSSC and TRANSCO for 2023 onwards RC2 Final Decision”, 2023. Accessed Oct. 22, 2024.
[38] “TAQA 2023 Annual Report”. Accessed Oct. 22, 2024.
[39] A. Focacci, “Residential plants investment appraisal subsequent to the new supporting photovoltaic economic mechanism in Italy,” Renewable and Sustainable Energy Reviews, vol. 13, no. 9, pp. 2710–2715, Dec. 2009. DOI
[40] W. Kessler, “Comparing energy payback and simple payback period for solar photovoltaic systems,” E3S Web of Conferences, vol. 22, no. 4, p. 00080, 2017. DOI
[41] Middle East Solar Industry Association, “Solar Outlook Report 2024”.
[42] IEA, “United Arab Emirates - Countries & Regions”, 2024. Accessed Nov. 04, 2024.
[43] “Electricity Generation Licensing Guide For Self-Supply Purposes”, 2023. Accessed May 08, 2025.
.png)
Explore MCC Economics’ evidence to the UK Climate Change Committee on strengthening the integrity and governance of carbon offsetting.
2022

Lorem ipsum dolor sit amet, consectetur adipiscing elit, sed do eiusmod tempor incididunt ut labore et dolore magna aliqua. Ut enim ad minim veniam, quis nostrud exercitation ullamco laboris nisi ut aliquip ex ea commodo consequat. Duis aute irure dolor in reprehenderit in voluptate velit esse cillum dolore eu fugiat nulla pariatur.
Block quote
Ordered list
Unordered list
Bold text
Emphasis
Superscript
Subscript

Discover the CCC's upcoming report on UK voluntary carbon offsets—insights from 56 stakeholders.
2020
Lorem ipsum dolor sit amet, consectetur adipiscing elit, sed do eiusmod tempor incididunt ut labore et dolore magna aliqua. Ut enim ad minim veniam, quis nostrud exercitation ullamco laboris nisi ut aliquip ex ea commodo consequat. Duis aute irure dolor in reprehenderit in voluptate velit esse cillum dolore eu fugiat nulla pariatur.
Block quote
Ordered list
Unordered list
Bold text
Emphasis
Superscript
Subscript

Advocating for equality, exploring its impact on growth, stability, crime, and health for informed policy-making.
2022
Lorem ipsum dolor sit amet, consectetur adipiscing elit, sed do eiusmod tempor incididunt ut labore et dolore magna aliqua. Ut enim ad minim veniam, quis nostrud exercitation ullamco laboris nisi ut aliquip ex ea commodo consequat. Duis aute irure dolor in reprehenderit in voluptate velit esse cillum dolore eu fugiat nulla pariatur.
Block quote
Ordered list
Unordered list
Bold text
Emphasis
Superscript
Subscript
I was delighted that MCC's work was completed on time, and within budget, helping us deliver important changes and improvements, to the benefit of our stakeholders. MCC's report is published on the CCC website.

I am delighted to recommend MCC Economics. Specifically, I worked closely with PJ, who helped us with our Nuclear and CCUS projects. PJ helped us develop new policies and answer questions from our stakeholders. His support helped us deliver important changes and improvements, to the benefit of our stakeholders.

MCC Economics has helped us better understand the most important issues for our stakeholders, including: charges, shareholder returns, debt payments and inflation impacts.

I am delighted to recommend PJ and his team at MCC Economics. We've been working together on National Policy Statements to help meet net zero targets for 2030 and 2050. We initially appointed MCC Economics to support us on offshore wind consultation analysis and have recently reappointed MCC Economics to undertake a larger consultation analysis role across all sectors, including hydrogen, CCUS and networks. I can confirm that PJ and his team have shown excellent spreadsheet skills, alongside very good project management, planning and analysis skills, helping us deliver important changes, and continuous improvements, to the benefit of our stakeholders.

I am delighted to recommend PJ and his team from MCC Economics. They helped us with our price controls for Heathrow airport and for NATS (En Route) plc (the air traffic services provider). Specifically, the MCC team helped us deliver important changes and improvements to our financial models and supporting policy documents, to the benefit of our stakeholders.

I am delighted to confirm that I worked with PJ on a retail project in 2015. The project helped stakeholders understand electricity costs and charges. Specifically, the project helped us explain to stakeholders, internally and externally, why electricity charges differed across the regions (GB, NI & Ireland). PJ was a key member on the project team, which helped deliver changes and improvements in the understanding of energy retail.

.png)

Evidence-based analysis for transparent, defensible, and effective decision-making.
© All rights reserved – MCC Economics 2026.
.jpeg)

