


This MCC paper explains how Abu Dhabi has regulated operating expenditure over time and what the evolution says about efficiency incentives, evidence standards, and regulatory maturity. Explore how benchmarking, conditional mechanisms, and forecasting discipline shape allowances and utility behaviour.
The paper traces the development of Opex setting in Abu Dhabi’s utility price controls, highlighting the shift from simpler historical baselines toward more structured, benchmarked approaches. It discusses how hybrid “top-down” and “bottom-up” methods, yardstick competition concepts, and conditional allowances influence the gap between company forecasts and allowed expenditure. The note also flags real-world uncertainties like inflation shocks and supply chain pressures and how adaptive mechanisms can balance consumer protection with operational realities.
Operating expenditure (Opex) refers to the ongoing costs required to run a utility’s daily operations: staff salaries, repairs and maintenance, customer service, IT systems, and other essential operational activities. Though less visible than capital investments, Opex is what ensures the continuous delivery of utility services across water, wastewater, and electricity networks.
In Abu Dhabi’s regulated utility sector, Opex plays a central role in price regulation. The regulator sets operating cost allowances based on what is judged to be efficient and necessary. These allowances are then used in calculating the Maximum Allowed Revenue (MAR) each company may recover. The goal is to strike a balance: allowing companies to recover prudent operating costs without passing unnecessary expenses on to consumers. This structure aligns with the principles of incentive regulation discussed by Joskow (2008), who reviews how price cap regulation, such as CPI-X, creates efficiency incentives in electricity networks by linking allowed revenues to external benchmarks and performance.
Over the past two decades, the methodology for determining Opex allowances has evolved significantly, reflecting growing regulatory sophistication and shifting sectoral priorities.
Figure 1: Opex projections for network companies (2016 prices)
Figure 1 illustrates the divergence between companies’ actual or forecasted Opex andthe allowances set by the regulator across the major network licensees (AADC, ADDC,TRANSCO, and ADSSC) between 1999 and 2021. Across all four companies, actual orforecast costs (in pink) generally exceeded the price control allowances (in brown),particularly during and after PC5. This trend highlights the regulator’s increasinglyconservative stance on allowed costs, and the growing gap between companyexpectations and what is deemed efficient. Notably, the step change around 2009reflects the sectoral restructuring and price control separations, while the flattening ofallowances in RC1 suggests a deliberate tightening of operating budgets under the newregulatory regime.Figure 2: RC1 final opex projections - comparison on aggregate level
In Figure 2, the graph aggregates the Opex trends across all network companies, comparing actual costs, company forecasts, and regulatory allowances from 1999 to 2021. A consistent pattern emerges: companies typically forecast higher spending than what the regulator ultimately allows, with actual expenditures often landing between the two. The sharp downward revision in the RC1 final proposals (2018–2021) compared to both the draft proposals and company forecasts is particularly notable, reflecting the regulator’s effort to enforce tighter discipline during this period. This illustrates how the regulatory approach has shifted toward more conservative assumptions and a firmer stance on cost containment.
In essence, the regulatory structure simulates competitive market pressures: companies are expected to operate within reasonable cost constraints (in this case, the cost envelope defined by the regulator). If they overspend, they typically bear the loss; if they underspend, they may retain a portion of the savings. This structure creates direct incentives for utilities to manage costs carefully without compromising service quality. That said, these cost incentives can have unintended effects. If not closely monitored, they may encourage companies to defer maintenance or reduce customer service inputs to stay within budget, potentially affecting long-term service quality. Regulators must therefore pair financial discipline with robust performance monitoring to ensure that cost efficiency does not come at the expense of reliability or consumer satisfaction.
Sedation is the side effect people taking lorazepam most frequently report. In a group of around 3,500 people treated for anxiety, the most common side effects complained of from lorazepam were sedation (15.9%), dizziness (6.9%), weakness (4.2%), and unsteadiness (3.4%). Side effects such as sedation and unsteadiness increased with age.Cognitive impairment, behavioral disinhibition and respiratory depression as well as hypotension may also occur.
Since the introduction of Abu Dhabi’s first Price Control (PC1), the regulator has used an “RPI-X” form of control, which places a ceiling on the aggregate level of allowed revenues for each year of the control period, thereby covering Opex as well. In PC1, the inflation term (“CPIₜ”) was based on a composite index (80% UAE CPI and 20% US CPI) reflecting the split between locally incurred and internationally sourced costs. The X-factor was intended to reflect profiling rather than enforce efficiency mechanisms directly. Over time, Opex allowances evolved not just due to inflation adjustments but also as a result of changes in the methodology used to assess efficient costs.
Between control periods, shifts in approach led to step changes in allowed Opex, as can be seen in Figure 3 below. Within a given control period, annual adjustments also varied across sectors, reflecting differences in how cost drivers and demand growth were handled for water, wastewater, and electricity services.
During PC1 (1999–2002), the regulatory approach to Opex was relatively unstructured. There was no benchmarking across companies or application of efficiency assumptions. Instead, Opex allowances were based primarily on historical data, particularly the 1997 and 1998 income statements. In cases where that data was insufficient, as was the case with ADWEC, the regulator relied on information from other relevant sources such as company budgets, recent spending figures, and benchmarks from Northern Ireland Electricity to establish a reasonable baseline.
The Bureau has reviewed information from a number of sources to inform its assessment of ADWEC’s future costs. In setting the price controls of other licensed companies the Bureau made use of those companies’ 1997 and 1998 income statements. ADWEC’s income statements are not helpful to the present exercise. This is because the responsibilities and functions now undertaken by ADWEC were previously undertaken by various sections of WED and it has not been possible to provide a meaningful assessment of these costs in the past. Nonetheless, the Bureau has reviewed and made use of information from the following sources:
This initial approach offered limited assurance of cost efficiency, as it lacked structured links to demand and no mechanisms for continuous improvement. These gaps laid the groundwork for future reforms in how Opex was assessed and allocated.
The approach began to shift in PC2 (2003–2005), when the regulator introduced a more structured methodology. A base-year model was adopted, using 2001 as the reference year for operating costs. Under this approach, Opex allowances were projected on the basis that Opex across the control period would remain constant at its 2001 level in real terms, with the assumption that efficiency improvements over the period would offset the effects on Opex of demand growth.
The Bureau has projected operating expenditure (Opex) for the period 2003–2005 on the basis that Opex can remain constant in real terms at its level in 2001. This assumes that the effect on Opex of demand growth over the period can be offset by efficiency improvements.
Where companies faced cost increases due to factors beyond routine operations (such as organisational restructuring or sharp rises in demand) those costs were not automatically included in the allowance. Instead, they were earmarked for review during the next price control period, allowing for retrospective consideration.
For the first time, the regulator introduced common set of parameters across all network licensees including a unified base year (2001), shared CPI assumptions, and standardised cost classifications support to more transparent and comparable allowance setting the beginning of a more systematic approach to setting Opex allowances base don comparability, predictability, and evidence.
Table 1: Operating Expenditure Allowances in PC2 - Final Proposals
Here’s the extracted content from your image (cleaned and readable):
With PC3 (2006–2009), the regulator introduced a more formula-driven methodology for setting Opex allowances. The 2004 cost base served as the starting point for projections. Allowances were then adjusted upward based on forecast demand growth, specifically by 0.75% for every 1% increase in projected service volume.
In parallel, a 5% annual reduction was applied to reflect assumed productivity gains. This adjustment reflected expectations that companies could lower costs over time through improvements in procurement, automation, or operational efficiency. Importantly, this assumed efficiency was embedded in the cost allowances themselves, rather than enforced through the X-factor, which in Abu Dhabi remained a revenue profiling tool rather than a driver of efficiency.
The Bureau has projected operating expenditure (opex) for 2006–2009 at a level in real terms of each business in 2004, with the following adjustments:
This approach mirrors elements of UK electricity distribution price controls, where fixed annual efficiency factors are applied within CPI-X frameworks. (Jamasb and Pollitt, 2007) provide an overview of how such productivity assumptions have been incorporated in UK regulation.
This method established a clearer baseline for expected performance and introduced greater consistency across licensees. It signaled a shift in regulatory stance away from cost allowances and toward more disciplined, model-based projections of what efficient operations should cost.
Even so, the introduction of formula-driven assumptions (such as the 0.75% cost scaling for every 1% increase in demand) raised questions for some observers. While these mechanisms aim to standardize projections, they can also appear somewhat mechanical or arbitrary if not clearly justified by empirical data. Over time, some stakeholders have cautioned that increasing methodological complexity may obscure assumptions rather than clarify them.
In PC4 (2010–2013), the regulator retained the overall structure of the PC3 approach but introduced refinements in how the base cost was established. Rather than relying solely on a single year’s expenditure, as had been done previously, the base Opex for each company was calculated as the simple average of the 2008 actual Opex and the 2009 projected Opex, both expressed in 2010 price terms.
The base Opex was then adjusted for demand growth and efficiency improvements (as in the previous price control). Specifically, a 0.75% increase in Opex was applied for every 1% increase in demand, and a 5% annual efficiency improvement was assumed in real terms.
This adjustment allowed the regulator to better capture cost trends that had emerged during the preceding control period, while still anchoring the new allowances in efficiency-based assumptions. It reflected a growing emphasis on smoothing year-to-year variations in Opex without relying excessively on a single year’s data.
For the Final Proposals, we have used the simple average of Opex projected for 2010 at the last price control review, and 2008 actual costs, both converted into 2010 prices, as the base level of opex for the PC4 period.
Here’s your clean extracted content from the image:
Opex regulation evolved further in PC5 (2014–2017), during which the sector experienced a marked increase in allowed operating costs. Compared to the previous control period, average annual Opex allowances were significantly higher, driven not only by inflation but also by a reassessment of utility responsibilities and service obligations. According to final regulatory proposals, proposed Opex allowances were greater than the draft proposals by approximately AED 820 million per year (in 2012 prices) relative to the draft values.
The proposed opex allowances are higher than various comparator figures on average over the PC5 period in real 2012 prices:
(a) higher than the draft proposals for each company by 21% - 42% or in aggregate by about AED 820 million per annum or 33% in 2012 prices (or AED 834 million per annum in 2014 prices);
This increase reflected the expanding responsibilities of the network companies. It covered growing commitments in areas such as training, Emiratisation, tariff reform implementation, health and safety compliance, and enhanced business planning functions. It also accounted for additional energy costs associated with more complex water pumping requirements, as infrastructure grew in scale and geographical reach.
Our final opex projections exclude a number of costs or activities identified by network companies as further discussions and explanations are required to make adjustments for these items. However, these projections include various specific cost allowances for additional roles and responsibilities (e.g., Emiratisation, training and apprenticeship, mega developments, energy costs for additional water pumping) as well as capability building in important areas (e.g., demand side management, risk management, business and financial planning, tariff reforms, health and safety). These projections will be adjusted during the PC5 period for various parameters and further responsibilities.
Table 4: PC5 Opex Projections (2014 prices) - Final Proposals
Below, Figure 5 shows how the final Opex allowance (red dashed line) significantlyexceeded the draft proposals (orange dashed line) yet remained below the companies’own latest forecasts (blue dashed line). The chart also highlights the continued gapbetween actual Opex and the regulator’s cost envelope, consistent with the regulator’sapproach in balancing expanding responsibilities with efficiency discipline.Figure 5: PC5 Final Opex Projections (2014 prices)
Although the allowances were higher, it is evident that the regulator opted to maintaina conservative approach. The final values were consistently lower than the companies’submitted forecasts, preserving the principle that Opex should reflect an efficient, notaspirational, level of expenditure.
The shift from PC5 to RC1 marked a refinement of Abu Dhabi’s approach to setting Opexallowances. Deloitte’s 7-step methodology, illustrated in Figure 6, built on the PC5framework by blending top-down projections with bottom-up efficiency benchmarking.This dual-track method aimed to reconcile high-level cost trends with operationalrealities across the utilities.
Abu Dhabi’s approach here is an application of “yardstick competition” (Shleifer 1985),using cost comparisons across similar firms to set efficient allowances and sharpenmanagerial incentives in monopoly regulation.
Figure 6: Consultant’s seven-step methodology to RC1 opex projections
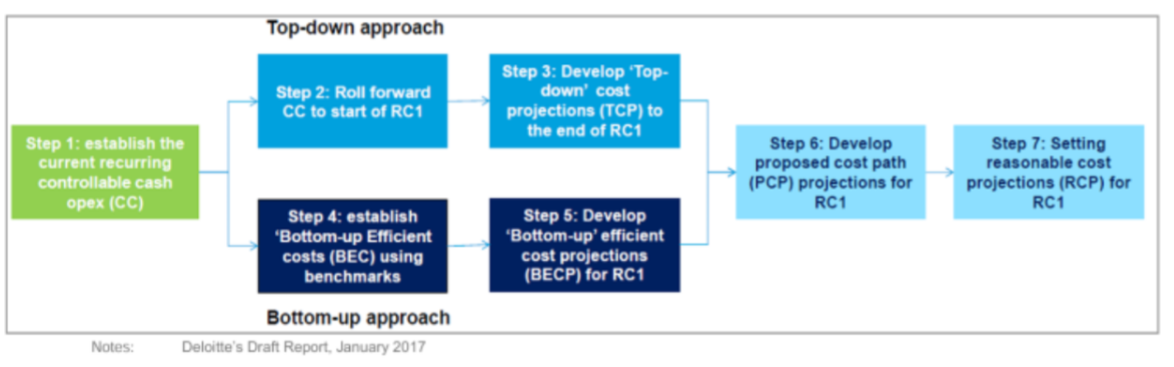
Figure 7: Consultant’s approach to RC1 opex projections
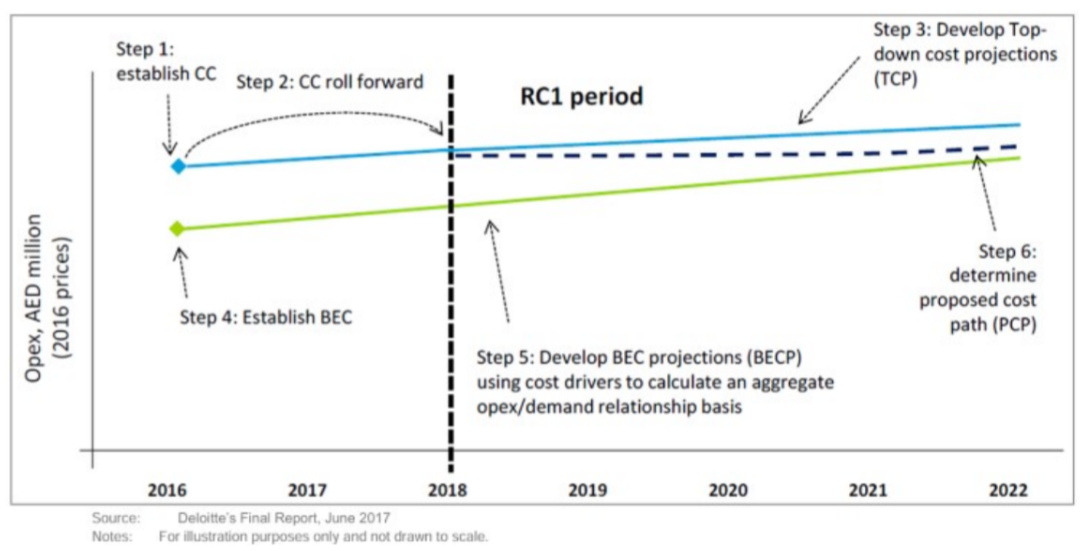
This structure is further illustrated in Figure 7, which visualises how these projections evolved across companies. It shows the resulting “reasonable cost paths” for RC1: amid point between companies’ forecasts and more conservative regulatory assumptions.
Together, these figures demonstrate how the RC1 methodology introduced greaterconsistency, transparency, and analytical rigour compared to earlier cycles. While themodel remains sensitive to input assumptions (such as demand or inflation), itsrepeatable structure has helped provide a consistent framework for efficiency-focusedregulation in Abu Dhabi’s utilities sector.
“It should be noted that the determination of ‘efficient’ Opex relies on available data andassumptions. Inaccuracies in demand forecasts or cost baselines may affect the accuracyof these projections.”
The RC1 control (2018–2021) marked a procedural shift toward a more analytical andconditional approach to Opex setting. The Department of Energy adopted a hybridapproach, combining top-down benchmarking with bottom-up evaluation of companyforecasts.
The starting point for RC1 allowances was the companies’ audited 2016 Opex (in 2018prices), which was then adjusted to include provisional allowances for specific activitiessuch as Emiratisation, direct staff training, and major developments, as well as savingsfrom operational changes. Certain costs were excluded, such as the Bureau’s licence feesand specific pumping or metering expenses.
Table 5: RC1 Opex Projections - Final Proposals
In RC2 (2023–2026), the Transformation Allowance mechanism was introduced tomanage cost items where the need for the initiative had been identified at a high level,but benefits could not yet be fully demonstrated. These costs were not included in theRC2 baseline Opex allowances. Instead, a ceiling was set for each company over thecontrol period (totalling AED 2,401 million in 2021 prices across all licensees), as shownin Table 6 below.
Eligible areas for submission under this mechanism were strictly limited to specific transformation programmes such as certain health initiatives, operational, financial andstrategic improvements, promotion of customer satisfaction, among other define dinitiatives, as well as certain company-specific costs (e.g., Operational Continuity forADDC, AMD and O&M for AADC, customer billing and RO polishing plants for ADSSC).
To recover these costs, companies were required to submit detailed proposals to the Department of Energy during RC2, demonstrating expected benefits, customer impact,project plans, milestones, deliverables, key performance indicators, and cost breakdowns. Approval was conditional on meeting these evidentiary requirements, with reimbursement made on an ex-post basis via an annual Opex adjustment.
Although this mechanism provided the regulator with flexibility to approve uncer taininitiatives as more evidence became available, it also introduced planning uncertaintyfor utilities, as recovery of costs depended on securing future approvals.
“While the framework accommodates uncertainty through mechanisms such as the Transformation Allowance, external events, such as inflation shocks or supply chain disruptions may still lead to deviations from projected operating costs, requiring ad hocre gulatory responses.”
As shown in Figure 8, the RC2 final Opex proposals (blue bars) came in below the companies’ own forecasts (purple bars) across all four utilities, reinforcing the regulator’s focus on disciplined, evidence-based allowances. The graph also illustrates how the RC2 allowances compare with both RC1 values and 2021 actuals, providing context for how the DoE calibrated expectations: higher than the previous control period, but still more conservative than what licensees had projected. This visual comparison underscores the regulator’s effort to balance flexibility (via mechanisms like the Transformation Allowance) with a continued emphasis on cost containment and justified need.
By incorporating such mechanisms, RC2 introduced a way to balance the need for exante control with the reality that utilities operate in a changing environment. The approach enabled regulatory flexibility without abandoning the efficiency discipline that underpins consumer protection
Throughout the evolution of Opex regulation, a consistent pattern has emerged: utilities tend to forecast higher operating costs than the regulator ultimately allows. While this gap is often interpreted as a sign of regulatory discipline or company inefficiency, some industry experts argue that it may also point to overly conservative allowances. In practice, essential but hard-to-predict costs such as urgent maintenance or innovation pilots may be excluded from the baseline, potentially leaving companies underfunded in critical areas.
This divergence has led to a tightening of regulatory practices, with the Department of Energy refining its tools for assessing forecasts, identifying outliers, and drawing comparisons across companies. Figures such as Figure 1, Figure 2, and Figure 8 illustrate this dynamic, where company projections often exceed regulatory allowances.
In response, licensees have also been prompted to improve their internal forecasting and cost justification processes. The shift away from historical averages toward evidencebased benchmarking has encouraged utilities to strengthen their data, build clearer business cases, and more rigorously analyse cost drivers.
Conditional elements introduced in RC1 and institutionalised in RC2 have further shaped this dynamic. These mechanisms allow for mid-period engagement and adjustment while maintaining a strong focus on efficiency and accountability.
Moreover, it is worth noting that utilities operate within a broader economic and policyenvironment. External factors such as inflation shocks, fuel price volatility, or newgovernment mandates can significantly influence Opex, sometimes in ways that aredifficult to predict or accommodate within fixed allowances. While the currentframework includes some adaptive mechanisms, ongoing vigilance is needed to ensurethat regulatory rigidity does not inadvertently penalise otherwise efficient operatorsfacing external pressures.
“The regulatory approach to Opex remains under development. Future price controlsmay revise the current methods as new challenges and priorities emerge, such as theintegration of decarbonisation targets or changes in digital infrastructure requirements.”
Summarily, over the past two decades, Abu Dhabi’s approach to regulating operating expenditure has moved through several distinct phases. It began with simple, historiccost baselines, then shifted to formula-driven adjustments that imposed explicit efficiency challenges, and later evolved into consultant-led reviews and benchmarking. Most recently, the framework has incorporated conditional allowances that make cost recovery dependent on evidence of value delivered.
A constant feature has been the treatment of X. Unlike other price controls, where X anannual efficiency factor, in Abu Dhabi X has mostly been set to zero. Instead, efficiencychallenges were applied directly in the allowance models through annual real cuts,demand scalers, baseline reductions, or conditional mechanisms. The exception is RC1,where small non-zero X factors were applied for electricity businesses, but even here the intent was to smooth revenues over time rather than to impose ongoing productivitysavings.
Table 7 below summarises this progression across successive price controls, showinghow the methodology and efficiency assumptions became more structured anddemanding over time.
Sources:
• 2002 Price Control Review, Page 17, 19
• 2005 Price Controls, Page 15
• 2002 Price Control Reviews, Page 21
• 2002 Price Control Reviews, Page 8
• 2005 Price Controls Review, Page 18
• 2005 Price Controls Review, Page 7
• 2009 Price Controls Review, Page 5
• 2013 Price Controls Review, Page 37
• 2018 Price Control Review, Page 68
The trajectory reflected in the table highlights how Abu Dhabi’s Opex regulation has matured into a framework that is both disciplined and adaptive. Each step built on the last: from historic baselines, to formulaic efficiency assumptions, to independent benchmarking, and finally to conditional, performance-linked allowances. This evolution serves three purposes. First, it keeps consumer tariffs affordable by ensuring companies cannot simply pass rising costs through unchecked. Second, it creates stronger incentives for efficiency by forcing companies to plan, justify, and
.jpeg)
Explore what AMP8’s £104bn programme means for customers, investors and delivery partners and the practical risks that could make or break outcomes by 2030.
Lorem ipsum dolor sit amet, consectetur adipiscing elit. Suspendisse varius enim in eros elementum tristique. Duis cursus, mi quis viverra ornare, eros dolor interdum nulla, ut commodo diam libero vitae erat. Aenean faucibus nibh et justo cursus id rutrum lorem imperdiet. Nunc ut sem vitae risus tristique posuere.
Lorem ipsum dolor sit amet, consectetur adipiscing elit. Suspendisse varius enim in eros elementum tristique. Duis cursus, mi quis viverra ornare, eros dolor interdum nulla, ut commodo diam libero vitae erat. Aenean faucibus nibh et justo cursus id rutrum lorem imperdiet. Nunc ut sem vitae risus tristique posuere.
About
Abstract

Lorem ipsum dolor sit amet, consectetur adipiscing elit, sed do eiusmod tempor incididunt ut labore et dolore magna aliqua. Ut enim ad minim veniam, quis nostrud exercitation ullamco laboris nisi ut aliquip ex ea commodo consequat. Duis aute irure dolor in reprehenderit in voluptate velit esse cillum dolore eu fugiat nulla pariatur.
Block quote
Ordered list
Unordered list
Bold text
Emphasis
Superscript
Subscript

Discover what Abu Dhabi’s 400 MW battery tender could unlock for grid stability, solar integration, and the next wave of storage procurements across the Gulf.
Lorem ipsum dolor sit amet, consectetur adipiscing elit. Suspendisse varius enim in eros elementum tristique. Duis cursus, mi quis viverra ornare, eros dolor interdum nulla, ut commodo diam libero vitae erat. Aenean faucibus nibh et justo cursus id rutrum lorem imperdiet. Nunc ut sem vitae risus tristique posuere.
Lorem ipsum dolor sit amet, consectetur adipiscing elit. Suspendisse varius enim in eros elementum tristique. Duis cursus, mi quis viverra ornare, eros dolor interdum nulla, ut commodo diam libero vitae erat. Aenean faucibus nibh et justo cursus id rutrum lorem imperdiet. Nunc ut sem vitae risus tristique posuere.
About
Abstract
Lorem ipsum dolor sit amet, consectetur adipiscing elit, sed do eiusmod tempor incididunt ut labore et dolore magna aliqua. Ut enim ad minim veniam, quis nostrud exercitation ullamco laboris nisi ut aliquip ex ea commodo consequat. Duis aute irure dolor in reprehenderit in voluptate velit esse cillum dolore eu fugiat nulla pariatur.
Block quote
Ordered list
Unordered list
Bold text
Emphasis
Superscript
Subscript

Empower UK government departments with structured case studies, optimizing public resources effectively.
Lorem ipsum dolor sit amet, consectetur adipiscing elit. Suspendisse varius enim in eros elementum tristique. Duis cursus, mi quis viverra ornare, eros dolor interdum nulla, ut commodo diam libero vitae erat. Aenean faucibus nibh et justo cursus id rutrum lorem imperdiet. Nunc ut sem vitae risus tristique posuere.
Lorem ipsum dolor sit amet, consectetur adipiscing elit. Suspendisse varius enim in eros elementum tristique. Duis cursus, mi quis viverra ornare, eros dolor interdum nulla, ut commodo diam libero vitae erat. Aenean faucibus nibh et justo cursus id rutrum lorem imperdiet. Nunc ut sem vitae risus tristique posuere.
About
Abstract
Lorem ipsum dolor sit amet, consectetur adipiscing elit, sed do eiusmod tempor incididunt ut labore et dolore magna aliqua. Ut enim ad minim veniam, quis nostrud exercitation ullamco laboris nisi ut aliquip ex ea commodo consequat. Duis aute irure dolor in reprehenderit in voluptate velit esse cillum dolore eu fugiat nulla pariatur.
Block quote
Ordered list
Unordered list
Bold text
Emphasis
Superscript
Subscript
I was delighted that MCC's work was completed on time, and within budget, helping us deliver important changes and improvements, to the benefit of our stakeholders. MCC's report is published on the CCC website.

I am delighted to recommend MCC Economics. Specifically, I worked closely with PJ, who helped us with our Nuclear and CCUS projects. PJ helped us develop new policies and answer questions from our stakeholders. His support helped us deliver important changes and improvements, to the benefit of our stakeholders.

MCC Economics has helped us better understand the most important issues for our stakeholders, including: charges, shareholder returns, debt payments and inflation impacts.

I am delighted to recommend PJ and his team at MCC Economics. We've been working together on National Policy Statements to help meet net zero targets for 2030 and 2050. We initially appointed MCC Economics to support us on offshore wind consultation analysis and have recently reappointed MCC Economics to undertake a larger consultation analysis role across all sectors, including hydrogen, CCUS and networks. I can confirm that PJ and his team have shown excellent spreadsheet skills, alongside very good project management, planning and analysis skills, helping us deliver important changes, and continuous improvements, to the benefit of our stakeholders.

I am delighted to recommend PJ and his team from MCC Economics. They helped us with our price controls for Heathrow airport and for NATS (En Route) plc (the air traffic services provider). Specifically, the MCC team helped us deliver important changes and improvements to our financial models and supporting policy documents, to the benefit of our stakeholders.

I am delighted to confirm that I worked with PJ on a retail project in 2015. The project helped stakeholders understand electricity costs and charges. Specifically, the project helped us explain to stakeholders, internally and externally, why electricity charges differed across the regions (GB, NI & Ireland). PJ was a key member on the project team, which helped deliver changes and improvements in the understanding of energy retail.

.png)

Evidence-based analysis for transparent, defensible, and effective decision-making.
© All rights reserved – MCC Economics 2026.

.png)