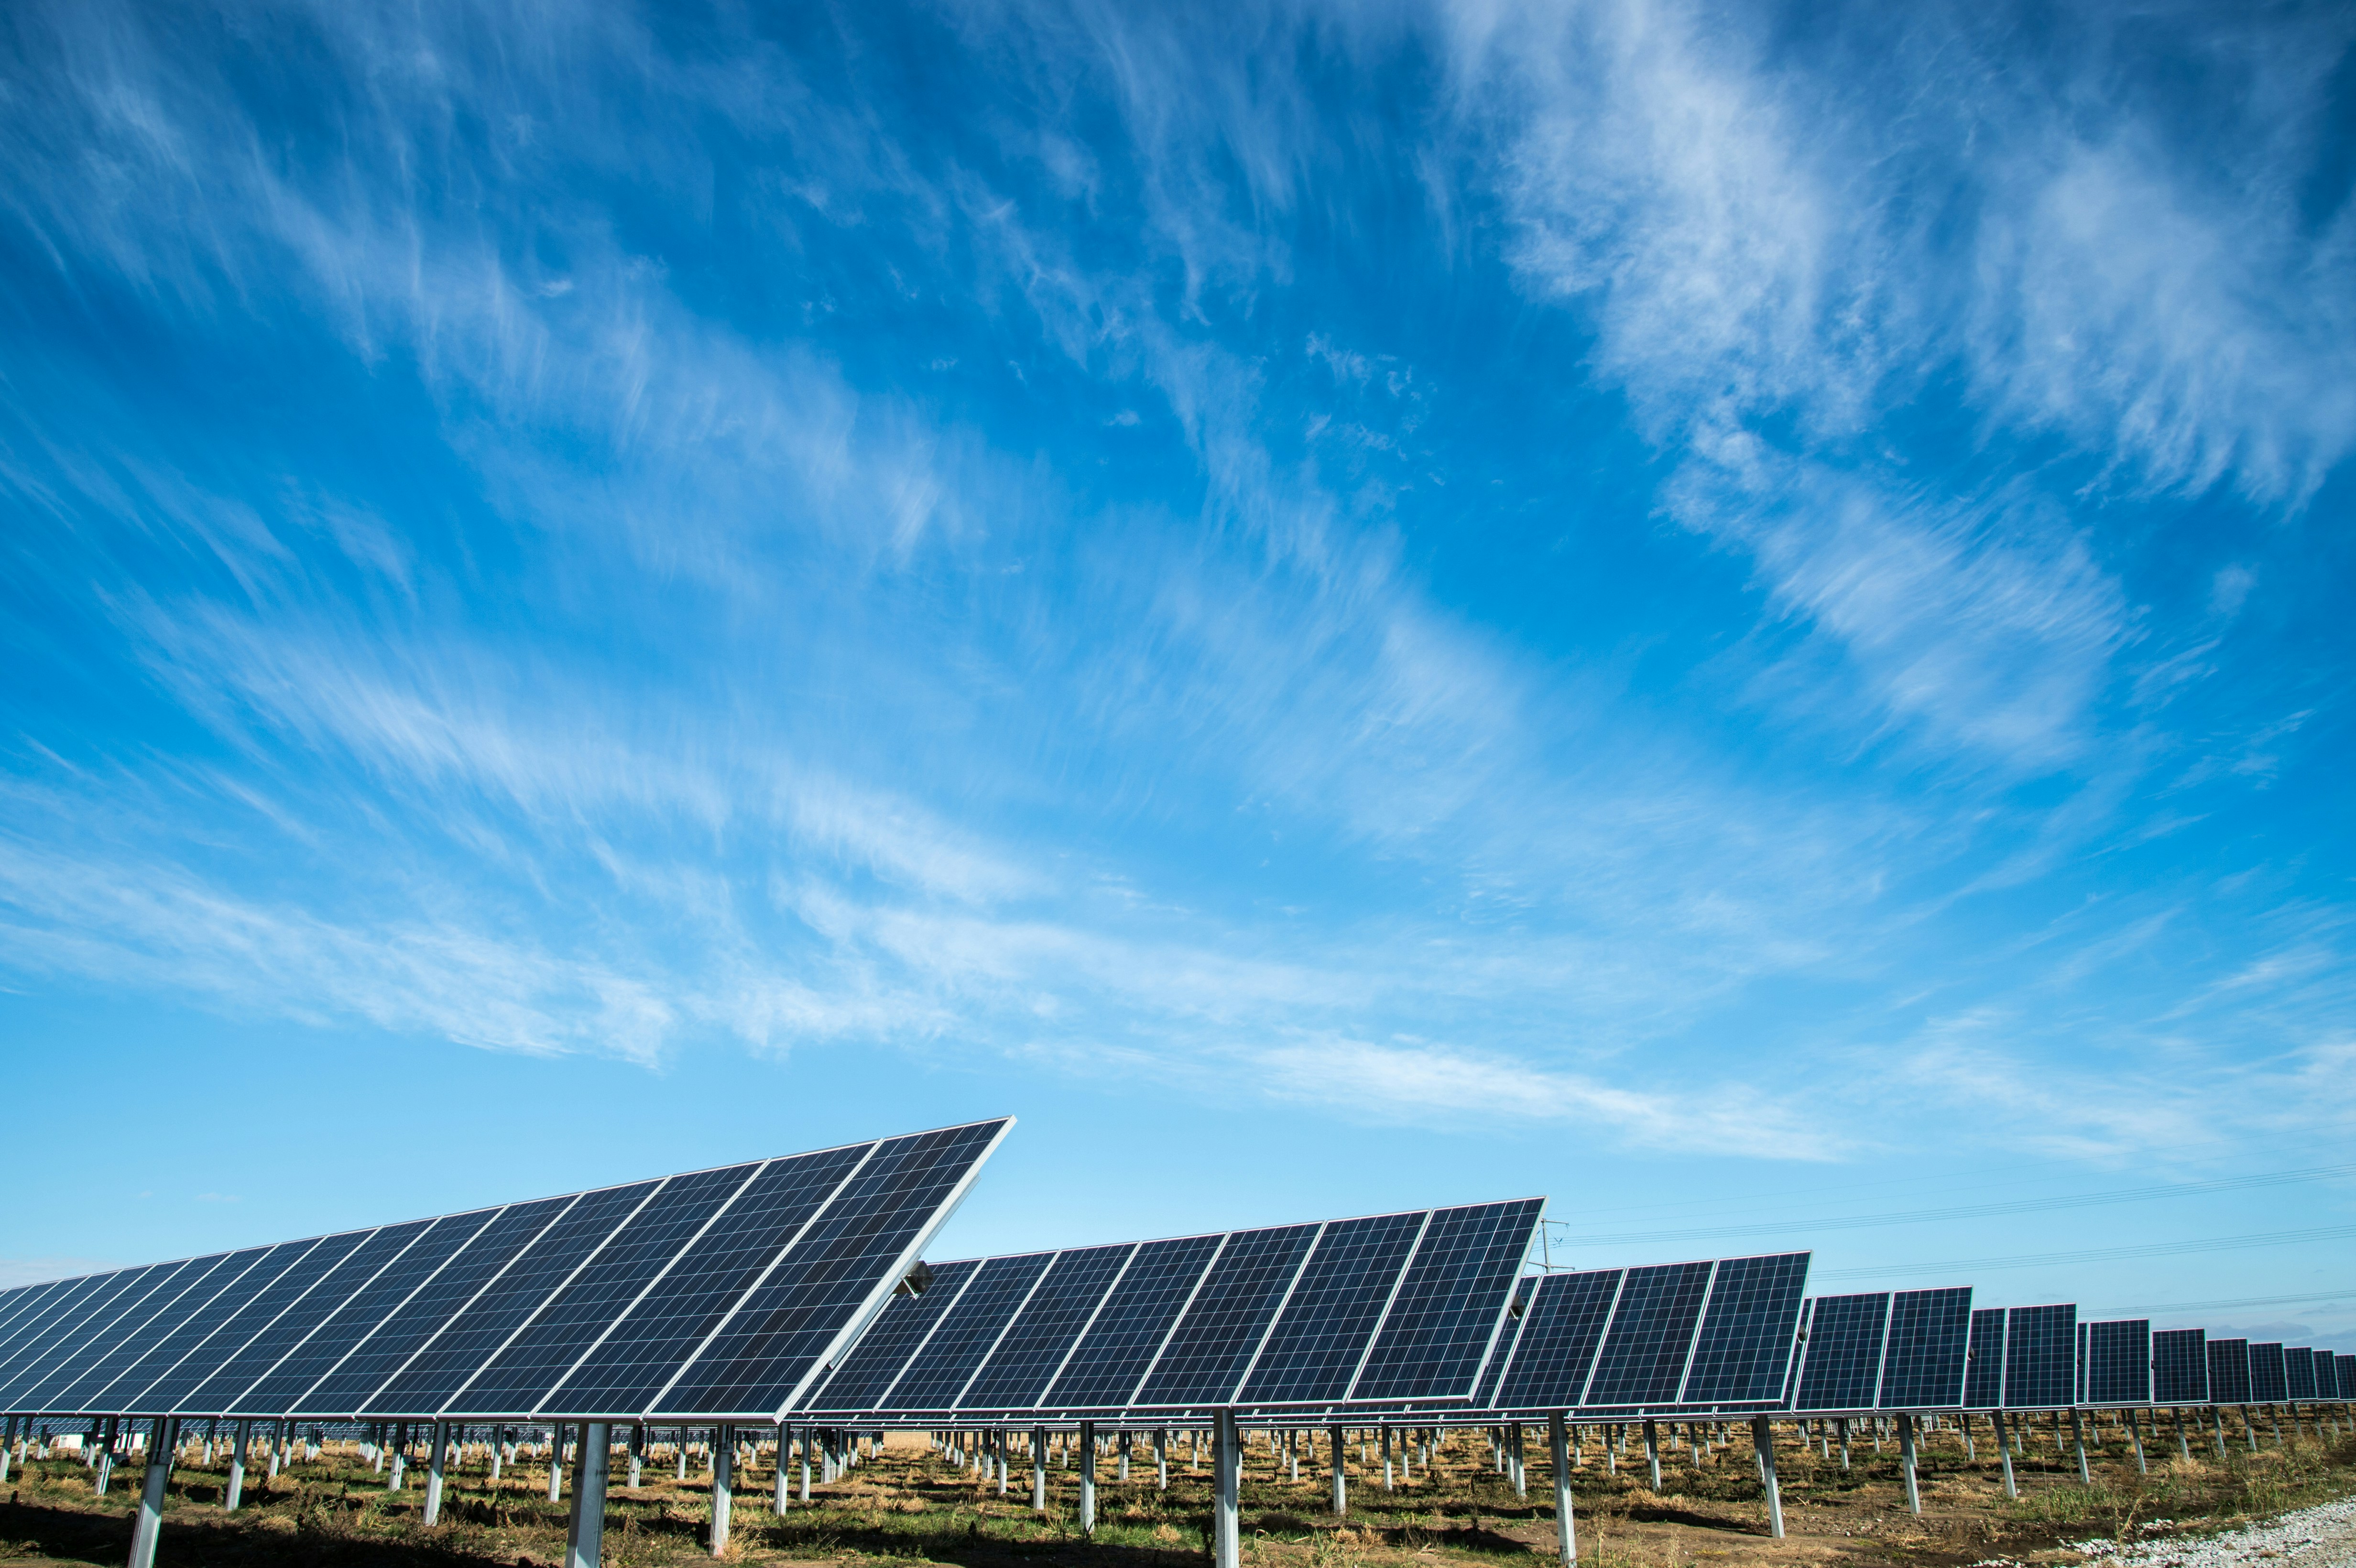
Investment in Distributed Solar - A case for Abu Dhabi, UAE

This analysis is built on MCC Economics’ regulatory and financial modelling work in the Gulf energy sector, drawing its figures from primary sources: the Abu Dhabi Department of Energy’s price-control determinations, the national generation company’s audited accounts, and the distribution company’s published tariffs. MCC advises regulators, utilities and investors on the economics of energy, and this paper applies that expertise to the case for distributed solar.

Quick Answer

Solar panels in Abu Dhabi now make electricity more cheaply than the power grid does. For most homes and businesses, the panels pay for themselves within a few years through lower bills. If more people used solar, the government could spend far less on the subsidy that keeps electricity cheap, saving up to around 1.5 billion dirhams a year by 2030 and cutting a large amount of pollution.

Key Takeaways

  • Solar makes electricity for about 12 fils a unit. Running the grid costs about 39 fils a unit, worked out from the Department of Energy’s price documents and TAQA’s 2023 accounts, so solar is much cheaper to produce.
  • How fast the panels pay for themselves depends on your electricity bill today. For most households that pay the normal rate, it takes roughly three to three and a half years. For businesses, about four to five years.
  • Households that already get the biggest government help pay so little for electricity that solar takes far longer to pay back, up to about twenty years.
  • The strongest of the three growth paths, 30 percent a year, could cut the government subsidy by around 1.5 billion dirhams a year by 2030 and avoid about 5 million tonnes of carbon dioxide a year, while covering only about a tenth of demand.
  • Very little solar is installed today, held back mainly by the cheap subsidised electricity, a habit of building only large solar farms, and rules that are still being worked out.

How much is the Middle East investing in clean energy?

Not much yet, but that is set to change. Across the Middle East, only about 20 cents goes into clean energy for every dollar spent on oil and gas. The International Energy Agency, the body that tracks global energy, expects clean-energy spending in the region to roughly double by 2030 as countries act on their climate promises. The United Arab Emirates has promised to reach net zero by 2050 and plans to invest more than 163 billion United States dollars in clean energy along the way.

Figure 1: Past and future energy investment in the Middle East, in billions of United States dollars, under two scenarios (Announced Pledges and Net Zero Emissions).

050100150200250
Fossil fuel supply
2016–2020
In this period, about 20 cents went to clean energy for every dollar invested in fossil fuels.
Fossil fuel power
2016–2020
In this period, about 20 cents went to clean energy for every dollar invested in fossil fuels.
Low-emissions power
2016–2020
In this period, about 20 cents went to clean energy for every dollar invested in fossil fuels.
Grids, storage and clean supply
2016–2020
In this period, about 20 cents went to clean energy for every dollar invested in fossil fuels.
End-use
2016–2020
In this period, about 20 cents went to clean energy for every dollar invested in fossil fuels.
Fossil fuel supply
2021–2023
Fossil fuel power
2021–2023
Low-emissions power
2021–2023
Grids, storage and clean supply
2021–2023
End-use
2021–2023
Fossil fuel supply
2024 (est.)
The IEA expects about USD 175 billion of investment in 2024, with clean energy around 15% of it.
Fossil fuel power
2024 (est.)
The IEA expects about USD 175 billion of investment in 2024, with clean energy around 15% of it.
Low-emissions power
2024 (est.)
The IEA expects about USD 175 billion of investment in 2024, with clean energy around 15% of it.
Grids, storage and clean supply
2024 (est.)
The IEA expects about USD 175 billion of investment in 2024, with clean energy around 15% of it.
End-use
2024 (est.)
The IEA expects about USD 175 billion of investment in 2024, with clean energy around 15% of it.
Fossil fuel supply
2026–2030 APS
Announced Pledges Scenario: countries deliver their stated climate commitments.
Fossil fuel power
2026–2030 APS
Announced Pledges Scenario: countries deliver their stated climate commitments.
Low-emissions power
2026–2030 APS
Announced Pledges Scenario: countries deliver their stated climate commitments.
Grids, storage and clean supply
2026–2030 APS
Announced Pledges Scenario: countries deliver their stated climate commitments.
End-use
2026–2030 APS
Announced Pledges Scenario: countries deliver their stated climate commitments.
Fossil fuel supply
2026–2030 NZE
Net Zero Emissions by 2050 Scenario: the deepest clean-energy shift.
Fossil fuel power
2026–2030 NZE
Net Zero Emissions by 2050 Scenario: the deepest clean-energy shift.
Low-emissions power
2026–2030 NZE
Net Zero Emissions by 2050 Scenario: the deepest clean-energy shift.
Grids, storage and clean supply
2026–2030 NZE
Net Zero Emissions by 2050 Scenario: the deepest clean-energy shift.
End-use
2026–2030 NZE
Net Zero Emissions by 2050 Scenario: the deepest clean-energy shift.
2016–2020
2021–2023
2024 (est.)
2026–2030 APS
2026–2030 NZE
Fossil fuel supplyFossil fuel powerLow-emissions powerGrids, storage and clean supplyEnd-use

Source: International Energy Agency, World Energy Investment 2024.

What it shows: past and forecast energy investment in the Middle East to 2030 under the Announced Pledges and Net Zero Emissions scenarios. Key takeaway: clean-energy spending roughly doubles by 2030 under announced pledges and rises almost six times under net zero, so the money is coming either way.

Why does cheap electricity slow solar down in Abu Dhabi?

Because the government pays part of everyone’s electricity bill, so the price people see is far below what the power really costs, and that leaves little reason to switch to solar. Solar is cheap to run, about 12 fils a unit. But a household getting the most help already pays only 7 fils, and a farm pays 5. When your electricity is that cheap, putting solar on your roof barely lowers your bill, even though solar itself is a bargain.

Behind the scenes, the real cost of grid electricity is much higher than the price people pay. MCC Economics estimates the true cost at 36 to 41 fils a unit, worked out from official price documents published by the Abu Dhabi Department of Energy and the 2023 accounts of the emirate’s main electricity company, TAQA. The government covers the gap. Redirecting some of that subsidy money into solar or efficiency would help the government, households and the environment at the same time.

“A better use of subsidy monies would be to invest directly in energy efficiency or distributed solar – potentially a win-win-win for government-consumers-environment.” MCC Economics, Investment in Distributed Solar report.

Figure 2: Stylised breakdown of the economic cost of electricity and the tariff, not to scale, as in the source diagram.

Generation
Making the electricity. Large solar farms like Al Dhafra can do this for as little as 0.05 dirhams a unit.
Transmission
Carrying power at high voltage from the generators towards towns and cities.
Distribution
The local poles, wires and substations that deliver power to homes: a large part of what consumers actually pay for.
Profits & supply costs
The retail layer: the costs and profits of supplying customers.
Average tariff
What consumers actually pay: between 0.05 and 0.29 dirhams a unit depending on the customer group (Table 1).
Average subsidy
The gap the government covers. MCC estimates the real cost of grid electricity at 0.36 to 0.41 dirhams a unit, far above most tariffs.
Money out: average economic cost
Money in

Proportions are illustrative, as in the source diagram; hover any block for what it covers.

What it shows: a stylised split of the real cost of electricity into generation, transmission and distribution, with the average tariff sitting below it. Key takeaway: the gap between real cost and tariff is the subsidy, and everything in this report flows from the size of that gap.

Figure 3: Residential electricity prices across the Gulf, in United States cents per kilowatt-hour, by consumer group and monthly consumption band.

00.020.040.060.080.10.120.140.16
World average, household users
Dubai — Nationals
1–1,000 kWh a month
Dubai — Nationals
1,001–2,000 kWh a month
Dubai — Nationals
2,001–3,000 kWh a month
Dubai — Nationals
3,001–4,000 kWh a month
Dubai — Nationals
4,001–5,000 kWh a month
Dubai — Nationals
5,001–6,000 kWh a month
Dubai — Nationals
6,001–7,000 kWh a month
Dubai — Nationals
7,001–8,000 kWh a month
Dubai — Nationals
8,001–9,000 kWh a month
Dubai — Nationals
9,001–10,000 kWh a month
Dubai — Nationals
Above 10,000 kWh a month
Dubai — Expats
1–1,000 kWh a month
Dubai — Expats
1,001–2,000 kWh a month
Dubai — Expats
2,001–3,000 kWh a month
Dubai — Expats
3,001–4,000 kWh a month
Dubai — Expats
4,001–5,000 kWh a month
Dubai — Expats
5,001–6,000 kWh a month
Dubai — Expats
6,001–7,000 kWh a month
Dubai — Expats
7,001–8,000 kWh a month
Dubai — Expats
8,001–9,000 kWh a month
Dubai — Expats
9,001–10,000 kWh a month
Dubai — Expats
Above 10,000 kWh a month
Sharjah — Nationals
1–1,000 kWh a month
Sharjah — Nationals
1,001–2,000 kWh a month
Sharjah — Nationals
2,001–3,000 kWh a month
Sharjah — Nationals
3,001–4,000 kWh a month
Sharjah — Nationals
4,001–5,000 kWh a month
Sharjah — Nationals
5,001–6,000 kWh a month
Sharjah — Nationals
6,001–7,000 kWh a month
Sharjah — Nationals
7,001–8,000 kWh a month
Sharjah — Nationals
8,001–9,000 kWh a month
Sharjah — Nationals
9,001–10,000 kWh a month
Sharjah — Nationals
Above 10,000 kWh a month
Sharjah — Expats
1–1,000 kWh a month
Sharjah — Expats
1,001–2,000 kWh a month
Sharjah — Expats
2,001–3,000 kWh a month
Sharjah — Expats
3,001–4,000 kWh a month
Sharjah — Expats
4,001–5,000 kWh a month
Sharjah — Expats
5,001–6,000 kWh a month
Sharjah — Expats
6,001–7,000 kWh a month
Sharjah — Expats
7,001–8,000 kWh a month
Sharjah — Expats
8,001–9,000 kWh a month
Sharjah — Expats
9,001–10,000 kWh a month
Sharjah — Expats
Above 10,000 kWh a month
Other UAE — Nationals
1–1,000 kWh a month
Other UAE — Nationals
1,001–2,000 kWh a month
Other UAE — Nationals
2,001–3,000 kWh a month
Other UAE — Nationals
3,001–4,000 kWh a month
Other UAE — Nationals
4,001–5,000 kWh a month
Other UAE — Nationals
5,001–6,000 kWh a month
Other UAE — Nationals
6,001–7,000 kWh a month
Other UAE — Nationals
7,001–8,000 kWh a month
Other UAE — Nationals
8,001–9,000 kWh a month
Other UAE — Nationals
9,001–10,000 kWh a month
Other UAE — Nationals
Above 10,000 kWh a month
Other UAE — Expats
1–1,000 kWh a month
Other UAE — Expats
1,001–2,000 kWh a month
Other UAE — Expats
2,001–3,000 kWh a month
Other UAE — Expats
3,001–4,000 kWh a month
Other UAE — Expats
4,001–5,000 kWh a month
Other UAE — Expats
5,001–6,000 kWh a month
Other UAE — Expats
6,001–7,000 kWh a month
Other UAE — Expats
7,001–8,000 kWh a month
Other UAE — Expats
8,001–9,000 kWh a month
Other UAE — Expats
9,001–10,000 kWh a month
Other UAE — Expats
Above 10,000 kWh a month
Saudi Arabia — Nationals and expats
1–1,000 kWh a month
Saudi Arabia — Nationals and expats
1,001–2,000 kWh a month
Saudi Arabia — Nationals and expats
2,001–3,000 kWh a month
Saudi Arabia — Nationals and expats
3,001–4,000 kWh a month
Saudi Arabia — Nationals and expats
4,001–5,000 kWh a month
Saudi Arabia — Nationals and expats
5,001–6,000 kWh a month
Saudi Arabia — Nationals and expats
6,001–7,000 kWh a month
Saudi Arabia — Nationals and expats
7,001–8,000 kWh a month
Saudi Arabia — Nationals and expats
8,001–9,000 kWh a month
Saudi Arabia — Nationals and expats
9,001–10,000 kWh a month
Saudi Arabia — Nationals and expats
Above 10,000 kWh a month
Oman — Nationals and expats
1–1,000 kWh a month
Oman — Nationals and expats
1,001–2,000 kWh a month
Oman — Nationals and expats
2,001–3,000 kWh a month
Oman — Nationals and expats
3,001–4,000 kWh a month
Oman — Nationals and expats
4,001–5,000 kWh a month
Oman — Nationals and expats
5,001–6,000 kWh a month
Oman — Nationals and expats
6,001–7,000 kWh a month
Oman — Nationals and expats
7,001–8,000 kWh a month
Oman — Nationals and expats
8,001–9,000 kWh a month
Oman — Nationals and expats
9,001–10,000 kWh a month
Oman — Nationals and expats
Above 10,000 kWh a month
Kuwait — Private houses
1–1,000 kWh a month
Kuwait — Private houses
1,001–2,000 kWh a month
Kuwait — Private houses
2,001–3,000 kWh a month
Kuwait — Private houses
3,001–4,000 kWh a month
Kuwait — Private houses
4,001–5,000 kWh a month
Kuwait — Private houses
5,001–6,000 kWh a month
Kuwait — Private houses
6,001–7,000 kWh a month
Kuwait — Private houses
7,001–8,000 kWh a month
Kuwait — Private houses
8,001–9,000 kWh a month
Kuwait — Private houses
9,001–10,000 kWh a month
Kuwait — Private houses
Above 10,000 kWh a month
Kuwait — Residential investment properties
1–1,000 kWh a month
Kuwait — Residential investment properties
1,001–2,000 kWh a month
Kuwait — Residential investment properties
2,001–3,000 kWh a month
Kuwait — Residential investment properties
3,001–4,000 kWh a month
Kuwait — Residential investment properties
4,001–5,000 kWh a month
Kuwait — Residential investment properties
5,001–6,000 kWh a month
Kuwait — Residential investment properties
6,001–7,000 kWh a month
Kuwait — Residential investment properties
7,001–8,000 kWh a month
Kuwait — Residential investment properties
8,001–9,000 kWh a month
Kuwait — Residential investment properties
9,001–10,000 kWh a month
Kuwait — Residential investment properties
Above 10,000 kWh a month
Bahrain — Nationals with one account
1–1,000 kWh a month
Bahrain — Nationals with one account
1,001–2,000 kWh a month
Bahrain — Nationals with one account
2,001–3,000 kWh a month
Bahrain — Nationals with one account
3,001–4,000 kWh a month
Bahrain — Nationals with one account
4,001–5,000 kWh a month
Bahrain — Nationals with one account
5,001–6,000 kWh a month
Bahrain — Nationals with one account
6,001–7,000 kWh a month
Bahrain — Nationals with one account
7,001–8,000 kWh a month
Bahrain — Nationals with one account
8,001–9,000 kWh a month
Bahrain — Nationals with one account
9,001–10,000 kWh a month
Bahrain — Nationals with one account
Above 10,000 kWh a month
Bahrain — Expats and nationals with more than one account
1–1,000 kWh a month
Bahrain — Expats and nationals with more than one account
1,001–2,000 kWh a month
Bahrain — Expats and nationals with more than one account
2,001–3,000 kWh a month
Bahrain — Expats and nationals with more than one account
3,001–4,000 kWh a month
Bahrain — Expats and nationals with more than one account
4,001–5,000 kWh a month
Bahrain — Expats and nationals with more than one account
5,001–6,000 kWh a month
Bahrain — Expats and nationals with more than one account
6,001–7,000 kWh a month
Bahrain — Expats and nationals with more than one account
7,001–8,000 kWh a month
Bahrain — Expats and nationals with more than one account
8,001–9,000 kWh a month
Bahrain — Expats and nationals with more than one account
9,001–10,000 kWh a month
Bahrain — Expats and nationals with more than one account
Above 10,000 kWh a month
World
average
Nationals
Expats
Nationals
Expats
Nationals
Expats
Nationals and expats
Private houses
Residential investment properties
Nationals with one account
Expats and nationals with more than one account
Dubai
Sharjah
Other UAE
Saudi Arabia
Oman
Kuwait
Bahrain

Every consumer group runs through the same eleven monthly consumption bands, from 1–1,000 kWh up to above 10,000 kWh; darker bars follow the source’s darker shading.

Source: Abuzaid, Al Moeilak and Alzaatreh (2022), Energy Strategy Reviews.

What it shows: residential electricity tariffs across the Gulf countries against the world average. Key takeaway: most Gulf tariffs sit far below the world average, which is why solar that beats the grid on cost can still struggle to beat the bill.

Table 1: Abu Dhabi electricity, what each consumer group pays and the subsidy that fills the gap up to the real cost of about 0.39 dirhams a unit.

Customer groupWhat they pay (dirhams a unit)Subsidy that fills the gap (dirhams a unit)
Households on the discount rate0.070.32
Households on the standard rate0.270.12
Shops and offices0.200.19
Industry0.290.10
Government users0.290.09
Farms0.050.34

Source: MCC analysis of the distribution company’s 2024 tariffs, the Department of Energy price documents and the generation company’s 2023 accounts.

Figure 4: The economic cost of electricity against what each Abu Dhabi consumer group pays and the subsidy that fills the gap, in dirhams per unit.

00.150.300.45
Average economic cost: about 0.39 dirhams a unit is what electricity really costs to make and deliver in Abu Dhabi.
UAE nationals: the tariff paid is 0.07 dirhams a unit (Table 1).
UAE nationals: the government covers about 0.32 dirhams a unit, the gap up to the 0.39 real cost.
Expatriates: the tariff paid is 0.27 dirhams a unit (Table 1).
Expatriates: the government covers about 0.12 dirhams a unit, the gap up to the 0.39 real cost.
Industry: the tariff paid is 0.29 dirhams a unit (Table 1).
Industry: the government covers about 0.10 dirhams a unit, the gap up to the 0.39 real cost.
Commercial: the tariff paid is 0.20 dirhams a unit (Table 1).
Commercial: the government covers about 0.19 dirhams a unit, the gap up to the 0.39 real cost.
Government: the tariff paid is 0.29 dirhams a unit (Table 1).
Government: the government covers about 0.09 dirhams a unit, the gap up to the 0.39 real cost.
Agriculture: the tariff paid is 0.05 dirhams a unit (Table 1).
Agriculture: the government covers about 0.34 dirhams a unit, the gap up to the 0.39 real cost.
Average
economic cost
UAE nationals
Expatriates
Industry
Commercial
Government
Agriculture
Economic costTariff paidSubsidy

Source: MCC analysis of the distribution company’s 2024 tariffs, the Department of Energy price documents and the generation company’s 2023 accounts.

What it shows: the real cost of electricity, about 0.39 dirhams a unit, next to each consumer group’s tariff with the government subsidy stacked on top. Key takeaway: every group pays less than the real cost, and the groups paying least, UAE nationals and agriculture, receive the biggest subsidy per unit.

Is solar a good investment in the United Arab Emirates?

For most homes and businesses, yes, and the biggest savings go to those who pay the normal rate for electricity rather than a heavily discounted one. MCC worked out the costs and savings for each type of customer using a financial model. A typical household on the standard rate gets its money back in about three to three and a half years, then keeps saving for the life of the panels, usually around twenty-five years. Shops and offices get their money back in about four to five years, and larger industrial sites in about the same. The exception is households on the discount rate, where the cheap electricity means solar takes up to about twenty years to pay for itself.

“To conclude, distributed solar is cheap enough, to benefit the UAE government (and the economy), in all our scenarios/customer groups.” MCC Economics, Investment in Distributed Solar report.

Table 2: Distributed solar by customer group in Abu Dhabi, showing system type, install cost, years to pay back and yearly return over 25 years. Payback is the time before savings cover the cost; return is the yearly gain on the money.

MeasureHousehold on discount rateHousehold on standard rateShop or officeIndustrial site
What they pay for electricity now (dirhams a unit)0.070.270.200.29
Type of solarRooftopRooftopRooftopGround-mounted
System size (kilowatts)44500900 to 3,000
Cost to install (thousand dirhams)9.8 to 10.69.8 to 10.61,224 to 1,3263,213 to 13,770
What the solar electricity costs (dirhams a unit)0.11 to 0.120.11 to 0.120.12 to 0.130.17 to 0.22
Years to pay back17.6 to 22.83.2 to 3.54.4 to 4.84.5 to 5.9
Yearly return over 25 years0.2% to 1.4%30.8% to 34.0%20.8% to 23.0%16.1% to 22.4%

What it shows: system type, install cost, payback and yearly return for each customer group. Key takeaway: payback runs about three to five years for everyone except discount-rate households, where cheap electricity stretches it to about twenty.

How much does rooftop solar cost, and can you put it on your house?

A typical home system costs roughly 9,800 to 10,600 dirhams to install, with only about 100 dirhams of upkeep in the first year. There is an important catch, though. The report notes that homes in Abu Dhabi are reportedly not yet allowed to install their own solar, so while the savings would work for a household, the option may not be open to you right now. Commercial and industrial sites face fewer restrictions, and their savings are strong, which is where most of the near-term opportunity sits. Anyone weighing a specific installation should check the current rules first, since they are still changing.

Is a big solar farm better than solar on your roof?

A large solar farm makes electricity more cheaply than rooftop panels, but that is not the whole story, because it leaves out the cost of getting the electricity to you. Big projects in the region are impressively cheap to run. The Al Dhafra solar farm produces at about 0.05 dirhams a unit. But a big farm’s low price only counts the cost of making the electricity, not the poles, wires and stations needed to carry it to homes, which is a large part of what you actually pay. Rooftop panels sit where the electricity is used, so they skip most of that delivery cost, and they add benefits a distant farm cannot, like charging an electric car at home and easing pressure on the grid at busy times. Both kinds are useful, and both are needed.

“However, LCOEs can be misleading as they only reflect the ‘generation’ costs and not the ‘landed’ electricity cost that consumers pay, a large element of which is transmission and distribution costs.” MCC Economics, Investment in Distributed Solar report.

Table 3: Cost to make electricity at large solar farms in the Gulf region, in dirhams per unit, lowest to highest.

Solar farmCost to make electricity (dirhams a unit)
MBR Phase 20.21
Askar Landfill0.14
MBR Phase 30.11
Sweihan0.11
MBR Phase 40.10
Sakaka0.09
MBR Phase 50.06
Al Karsaah0.06
Al Dhafra0.05

Source: MCC compilation; Al Dhafra figure from the Emirates Water and Electricity Company.

Figure 5: What large Gulf solar farms charge for their electricity, in dirhams per unit, highest to lowest.

MBR Phase 2, Dubai
0.21
MBR Phase 2, Dubai: 0.21 dirhams a unit (Table 3)
Askar Landfill, Bahrain
0.14
Askar Landfill, Bahrain: 0.14 dirhams a unit (Table 3)
MBR Phase 3, Dubai
0.11
MBR Phase 3, Dubai: 0.11 dirhams a unit (Table 3)
Sweihan, Abu Dhabi
0.11
Sweihan, Abu Dhabi: 0.11 dirhams a unit (Table 3)
MBR Phase 4, Dubai
0.10
MBR Phase 4, Dubai: 0.10 dirhams a unit (Table 3)
Sakaka, Saudi Arabia
0.09
Sakaka, Saudi Arabia: 0.09 dirhams a unit (Table 3)
MBR Phase 5, Dubai
0.06
MBR Phase 5, Dubai: 0.06 dirhams a unit (Table 3)
Al Karsaah, Qatar
0.06
Al Karsaah, Qatar: 0.06 dirhams a unit (Table 3)
Al Dhafra, Abu Dhabi
0.05
Al Dhafra, Abu Dhabi: 0.05 dirhams a unit (Table 3). The cheapest in the region, and the benchmark used through this article.

Costs fall as projects get newer and larger; hover any bar. The navy bar is Al Dhafra, the cheapest.

Source: MCC compilation; Al Dhafra figure from the Emirates Water and Electricity Company.

What it shows: the contracted cost of electricity at nine large Gulf solar farms, from 0.21 dirhams a unit at the earliest Dubai project down to 0.05 at Al Dhafra. Key takeaway: each new project has come in cheaper than the last, and the cheapest now undercuts every tariff in Abu Dhabi.

Figure 6: Solar generation costs against the economic cost of electricity and tariffs in Abu Dhabi, in dirhams per unit.

Solar cost to generate

Utility-scale solar
0.06
Utility-scale solar generates at about 0.06 dirhams a unit.
Roof-top solar
0.12
Roof-top solar generates at about 0.12 dirhams a unit, below the 0.39 economic cost.
Ground-mounted solar
0.22
Ground-mounted distributed solar generates at about 0.22 dirhams a unit.

Economic cost of electricity

Economic cost
0.39
The full economic cost of grid electricity: about 0.39 dirhams a unit.
Implied split
Generation’s share of the 0.39 economic cost, drawn to the source figure’s proportions; the source prints no number for this split.
Transmission, distribution and other costs make up the rest of the 0.39, drawn to the source figure’s proportions.

Retail tariffs

UAE nationals
0.07
UAE nationals pay 0.07 dirhams a unit (Table 1), below every solar option.
Expatriates
0.27
Expatriates pay 0.27 dirhams a unit (Table 1), above rooftop solar’s 0.12.
Average tariff and subsidy
0.25
The average tariff collected: 0.25 dirhams a unit, as printed in the source figure.
0.14
The average subsidy: 0.14 dirhams a unit, as printed in the source figure.

What it shows: the three solar options against the full economic cost of grid electricity and the tariffs people actually pay, with the source’s two split bars. Key takeaway: rooftop solar at 0.12 dirhams beats the 0.39 economic cost and the expatriate tariff of 0.27, so it pays for everyone except the most heavily subsidised groups.

Figure 7: Historical and forecast solar capacity in Abu Dhabi, centralised against three distributed scenarios, in gigawatts.

02468102018202020222024202620282030ForecastCentralised solar: the large farms, 0.1 GW in 2018 to a forecast 10.3 GW by 2030.Scenario A, 10% yearly growth in additions: 2.4 GW of distributed solar by 2030.Scenario B, 21% yearly growth in additions: 3.1 GW of distributed solar by 2030.Scenario C, 30% yearly growth in additions: 3.8 GW of distributed solar by 2030.Centralised solar begins at 0.1 GW in 2018.Noor Abu Dhabi takes centralised capacity to 1.3 GW, held through 2019 to 2021.Al Dhafra lifts centralised capacity to 3.4 GW in 2022 and 2023.Al Ajban is forecast to raise centralised capacity to 5.5 GW.Further projects are forecast to reach 7.9 GW.10.3 GW of centralised solar by 2030, the report’s forecast.Scenario A, 10% yearly growth in additions: 2.4 GW of distributed solar by 2030.Scenario B, 21% yearly growth in additions: 3.1 GW of distributed solar by 2030.Scenario C, 30% yearly growth in additions: 3.8 GW of distributed solar by 2030.Distributed solar starts below 0.1 GW today; the three curves are the scenario growth paths.Centralised (large farms)Scenario AScenario BScenario C

Hover any line for its story, or any marked point for its value; markers sit only where the source chart prints a value or milestone. The distributed curves are drawn as smooth growth paths between their published start and 2030 endpoints.

What it shows: the report’s full capacity picture, the centralised build-out from 0.1 gigawatts in 2018 to a forecast 10.3 by 2030, against the three distributed-solar growth scenarios from Table 4. Key takeaway: even the fastest distributed path reaches 3.8 gigawatts by 2030, so distributed solar complements rather than replaces the large farms, while cutting the subsidy bill every year.

Table 4: Three distributed-solar growth scenarios for Abu Dhabi to 2030, with the subsidy saved and carbon avoided under each, alongside large solar farms for comparison.

MeasureSlow growthMedium growthFast growthLarge solar farms for comparison
Yearly growth from 202410%21%30%20%
Solar capacity by 2030 (gigawatts)2.43.13.810.3
Electricity made in 2030 (gigawatt-hours)6,6588,65910,82329,073
Subsidy saved in 2030 (million dirhams)9031,1751,4683,943
Carbon avoided in 2030 (million tonnes a year)3.14.05.013.5

What it shows: the three growth scenarios with the subsidy saved and carbon avoided under each. Key takeaway: even the slowest path saves around 900 million dirhams of subsidy a year by 2030, and the 30 percent path reaches about 1.5 billion dirhams and 5 million tonnes of carbon avoided.

References

  1. International Energy Agency, World Energy Investment 2024, Middle East. Source of the regional investment figures and Figure 1.
  2. International Trade Administration, United Arab Emirates renewable and clean energy, 2024. Source of the 163 billion dollar clean energy investment plan and the net zero 2050 commitment.
  3. Abu Dhabi Distribution Company, Utility Tariff 2024. Source of the consumer tariffs in Tables 1 and 2.
  4. Abu Dhabi Department of Energy, price control final decision, 2023. Primary source for the real cost of grid electricity.
  5. TAQA, 2023 Annual Report. The generation company’s audited accounts used in the real-cost estimate.
  6. Emirates Water and Electricity Company, Al Dhafra Solar project. Source of the Al Dhafra generation cost and Figure 6.

Author

 What’s next

The approach for Abu Dhabi’s solar energy : Centralised or Decentralised

Explore our latest paper which examines Abu Dhabi’s solar approach—centralised utility-scale vs. distributed rooftop generation. Finds rooftop PV still uneconomical for heavily subsidised user groups but cost-effective for industry and commerce, suggesting subsidy reforms to unlock distributed solar for 2050 climate goals.

Heading 1

Heading 2

Heading 3

Heading 4

Heading 5
Heading 6

Lorem ipsum dolor sit amet, consectetur adipiscing elit, sed do eiusmod tempor incididunt ut labore et dolore magna aliqua. Ut enim ad minim veniam, quis nostrud exercitation ullamco laboris nisi ut aliquip ex ea commodo consequat. Duis aute irure dolor in reprehenderit in voluptate velit esse cillum dolore eu fugiat nulla pariatur.

Block quote

Ordered list

  1. Item 1
  2. Item 2
  3. Item 3

Unordered list

  • Item A
  • Item B
  • Item C

Text link

Bold text

Emphasis

Superscript

Subscript

The Role of Utilities in Demand-Side Management for Solar Integration (2025)

Explore MCC’s 2025 view on DSM - how utilities can use flexible demand to integrate more solar, cut system costs, and relieve grid constraints.

Heading 1

Heading 2

Heading 3

Heading 4

Heading 5
Heading 6

Lorem ipsum dolor sit amet, consectetur adipiscing elit, sed do eiusmod tempor incididunt ut labore et dolore magna aliqua. Ut enim ad minim veniam, quis nostrud exercitation ullamco laboris nisi ut aliquip ex ea commodo consequat. Duis aute irure dolor in reprehenderit in voluptate velit esse cillum dolore eu fugiat nulla pariatur.

Block quote

Ordered list

  1. Item 1
  2. Item 2
  3. Item 3

Unordered list

  • Item A
  • Item B
  • Item C

Text link

Bold text

Emphasis

Superscript

Subscript

Featured

This paper has been published on following other platforms

I was delighted that MCC's work was completed on time, and within budget, helping us deliver important changes and improvements, to the benefit of our stakeholders. ​ MCC's report is published on the CCC website.

- Bea Natzler
Team Leader at Climate Change Committee, UK

I am delighted to recommend MCC Economics. Specifically, I worked closely with PJ, who helped us with our Nuclear and CCUS projects. PJ helped us develop new policies and answer questions from our stakeholders. ​​His support helped us deliver important changes and improvements, to the benefit of our stakeholders.

- Gordon Hutcheson
Head of Nuclear Policy at Ofgem, UK

MCC Economics has helped us better understand the most important issues for our stakeholders, including: charges, shareholder returns, debt payments and inflation impacts.

- Leila N. Nasr
Section Head at Department of Energy, Abu Dhabi

I am delighted to recommend PJ and his team at MCC Economics. We've been working together on National Policy Statements to help meet net zero targets for 2030 and 2050. We initially appointed MCC Economics to support us on offshore wind consultation analysis and have recently reappointed MCC Economics to undertake a larger consultation analysis role across all sectors, including hydrogen, CCUS and networks. I can confirm that PJ and his team have shown excellent spreadsheet skills, alongside very good project management, planning and analysis skills, helping us deliver important changes, and continuous improvements, to the benefit of our stakeholders.

- Amy McHugh
Head of Environment in the Energy Infrastructure Planning Policy, UK

I am delighted to recommend PJ and his team from MCC Economics. They helped us with our price controls for Heathrow airport and for NATS (En Route) plc (the air traffic services provider). Specifically, the MCC team helped us deliver important changes and improvements to our financial models and supporting policy documents, to the benefit of our stakeholders.

- Dan Rock
Head of Corporate Finance at CAA, UK

I am delighted to confirm that I worked with PJ on a retail project in 2015. The project helped stakeholders understand electricity costs and charges. Specifically, the project helped us explain to stakeholders, internally and externally, why electricity charges differed across the regions (GB, NI & Ireland). PJ was a key member on the project team, which helped deliver changes and improvements in the understanding of energy retail.
- Kevin Shiels
Director at Utility Regulator, Northern Ireland